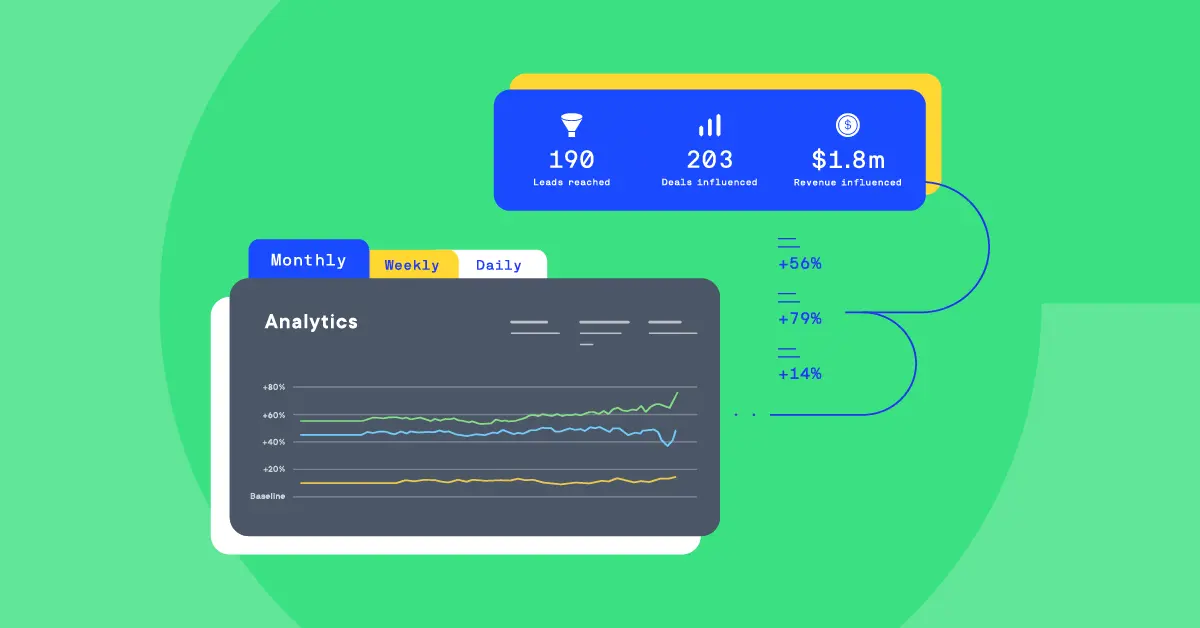
Content marketing ROI: Metrics to measure brand equity
By using this step-by-step guide, you'll be able to set yourself up to measure your content marketing ROI and prove the effectiveness of your content.
Updated September 1st, 2021
When it comes to their biggest challenge, most content marketers are in agreement: They’re struggling to measure content marketing return on investment (ROI).
At our conferences and workshops, that’s the question people most often ask us: “How can I measure the effectiveness of my content?”
And that’s understandable.
For many years, digital marketing teams based their success on metrics like pageviews and impressions.
This was primarily due to the fact that we were limited by the technology and measurement tools available at the time.
As the industry evolved, it became clear that those metrics were a better indication of vanity metric-boosting ad spends, rather than quality or brand growth.
Over time, we entered a new era of marketing focused on engagement. Marketers turned to metrics like attention, conversion rates, bounce rate, and time-on-page to better prove content marketing ROI.
Now, marketers are looking for even more proof that their content marketing efforts are leading to real business results.
When meeting with CMOs and defending their content budgets, marketers are on the hot seat to deliver hard metrics and prove that their content marketing strategy is driving real business results that yield lead generation.
Due to this demand, and the ability to better track the customer journey, we’re moving into an era of performance measurement.
All content marketing campaigns will be tied to achieving business goals – and marketers will be able to measure content marketing ROI with their work.
At this point, there is a clear connection between content marketing and consumer behavior.
The articles people read, the videos they watch, the podcasts they listen to, the webinars they attend, and the case studies they consume ultimately influence their buying decisions. The average person engages with 11.4 pieces of content before making a purchase, according to Nielsen.
At Welcome, we’ve found that people engage with about 20 pieces of content before converting to customers. And prospects who have read our blog, attended a webinar, or subscribed to our email newsletter are twice as likely to take a meeting with us to learn more about our content marketing platform.
We’ve been able to determine this because we have the systems in place to measure content marketing ROI.
And are you ready for some great news?
You can, too.
You just need to determine your business goals and set up systems to track the related metrics. (Even more good news: You can do this without needing technical support or purchasing new analytics programs.)
So, if Google Analytics isn’t your thing, or you’re looking for something to supplement Google Analytics, then we’ve got you covered.
This will require a bit of upfront work, but once those systems are in place, you’ll be able to definitively state how well your content marketing efforts are working.
By using this step-by-step optimization roadmap as your guide, you’ll be able to set yourself up to reap the true ROI of content marketing that you can measure.
Step 1: Choose Your Business Case
Since the goal of content marketing is to measure business results, you first need to define what you hope to achieve.
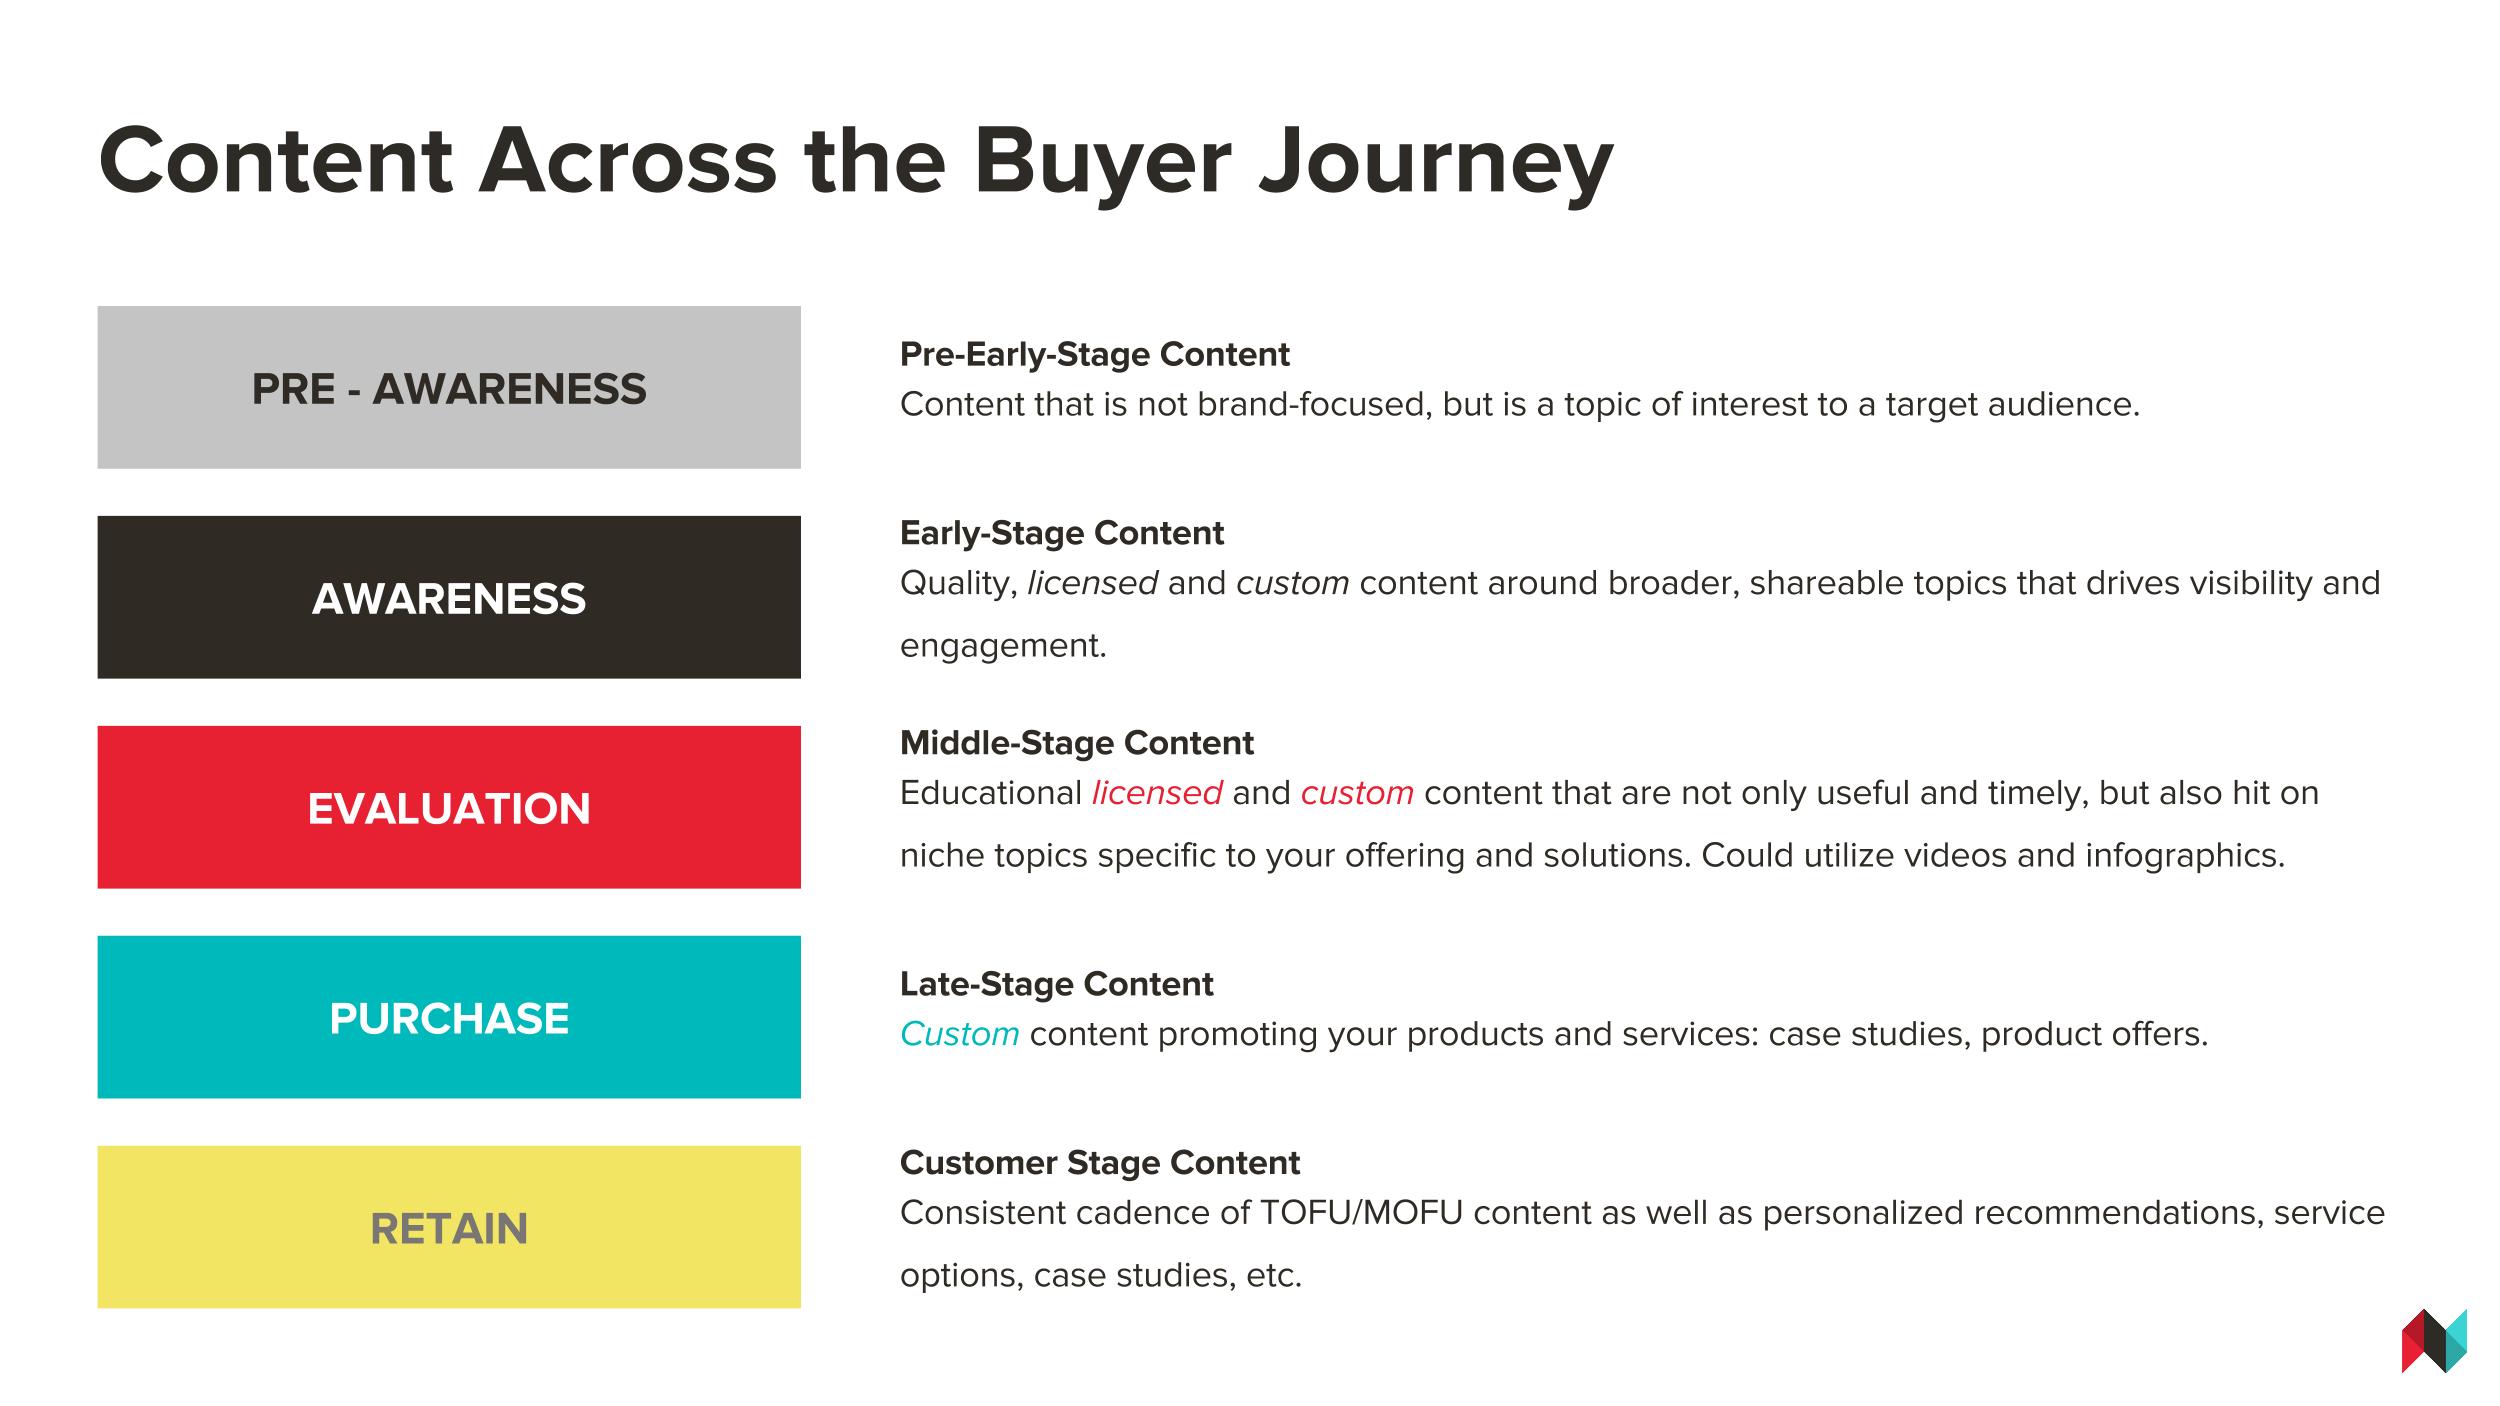
- Brand Equity: Are you looking to build brand awareness, and use content creation to help early stage prospects find their way to your website? Or are you interested in improving brand health, and want to create content that will change the way your digital audience feels about your brand?
- Conversions: Do you want to quantify the number of prospects who became customers because they’ve built a relationship with you through your content? Are you looking to increase the number of leads your content marketing strategy is responsible for?
- Loyalty: Are you hoping to engage and inform existing customers through content creation, with the ultimate goal of retaining them?
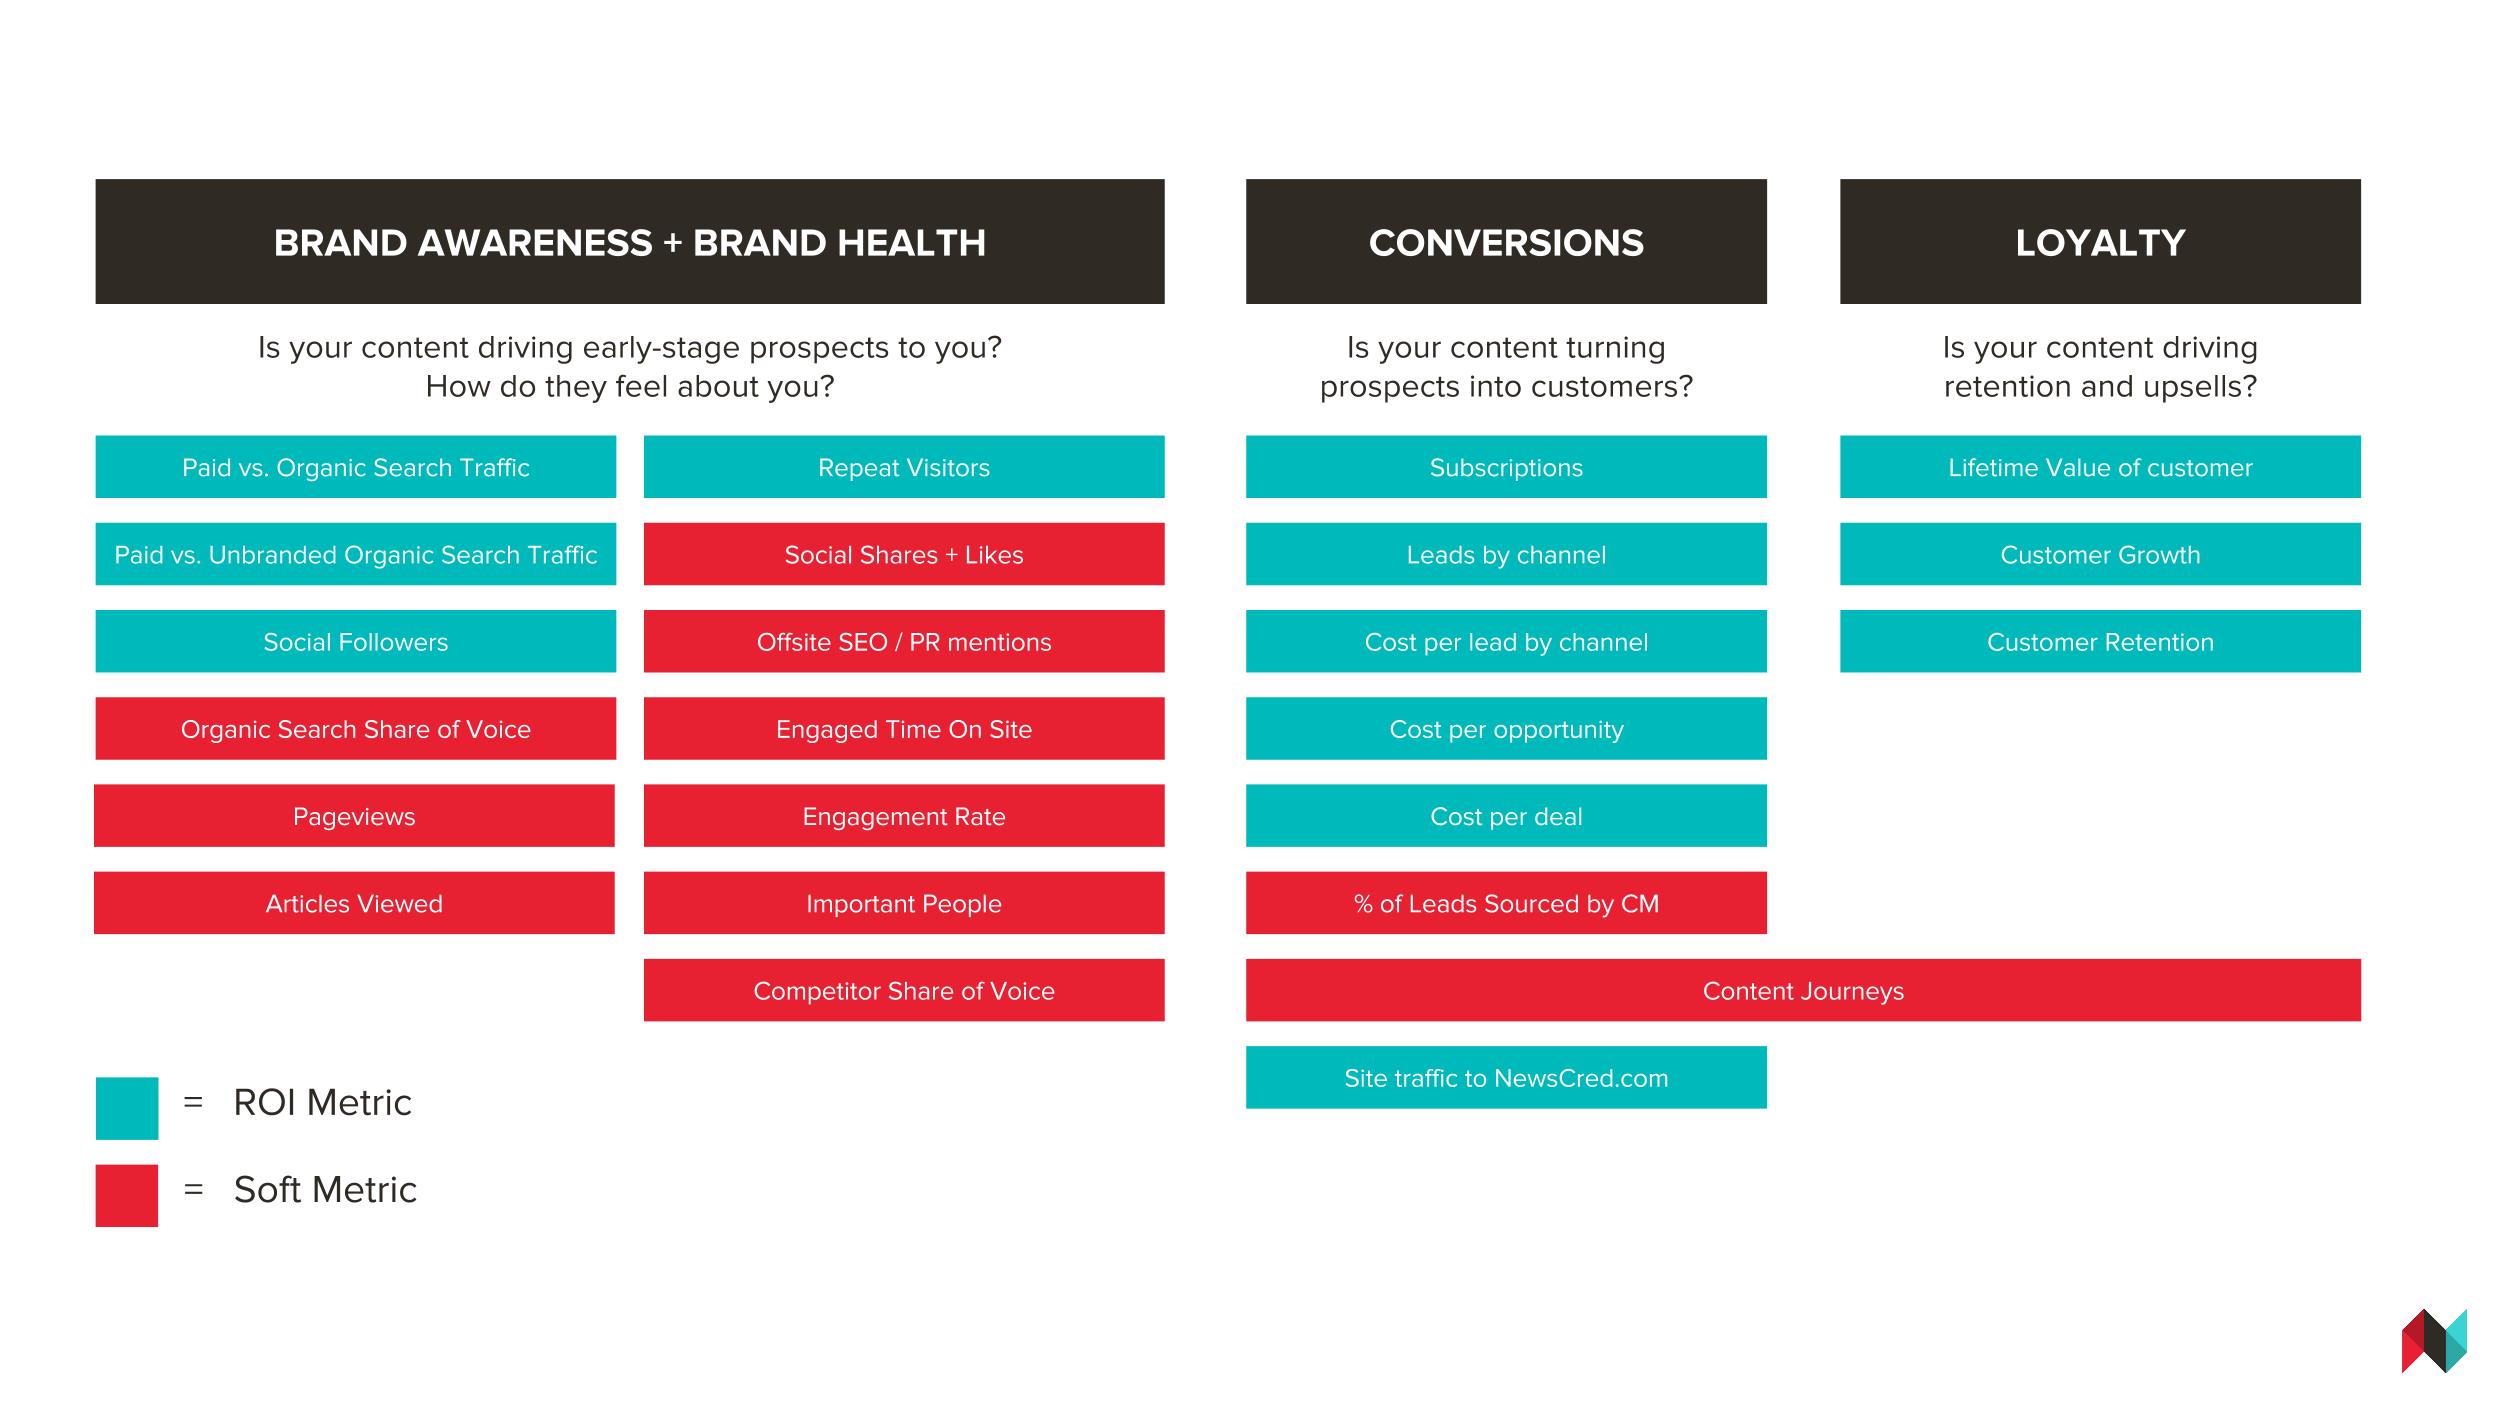
Step 2: Determine the KPIs to Measure Your Business Case
This chart details KPIs that align with each business objective.
1. Paid Vs. Organic Search Traffic
Most marketers have experience using paid search, and are well-versed with its pros and cons.
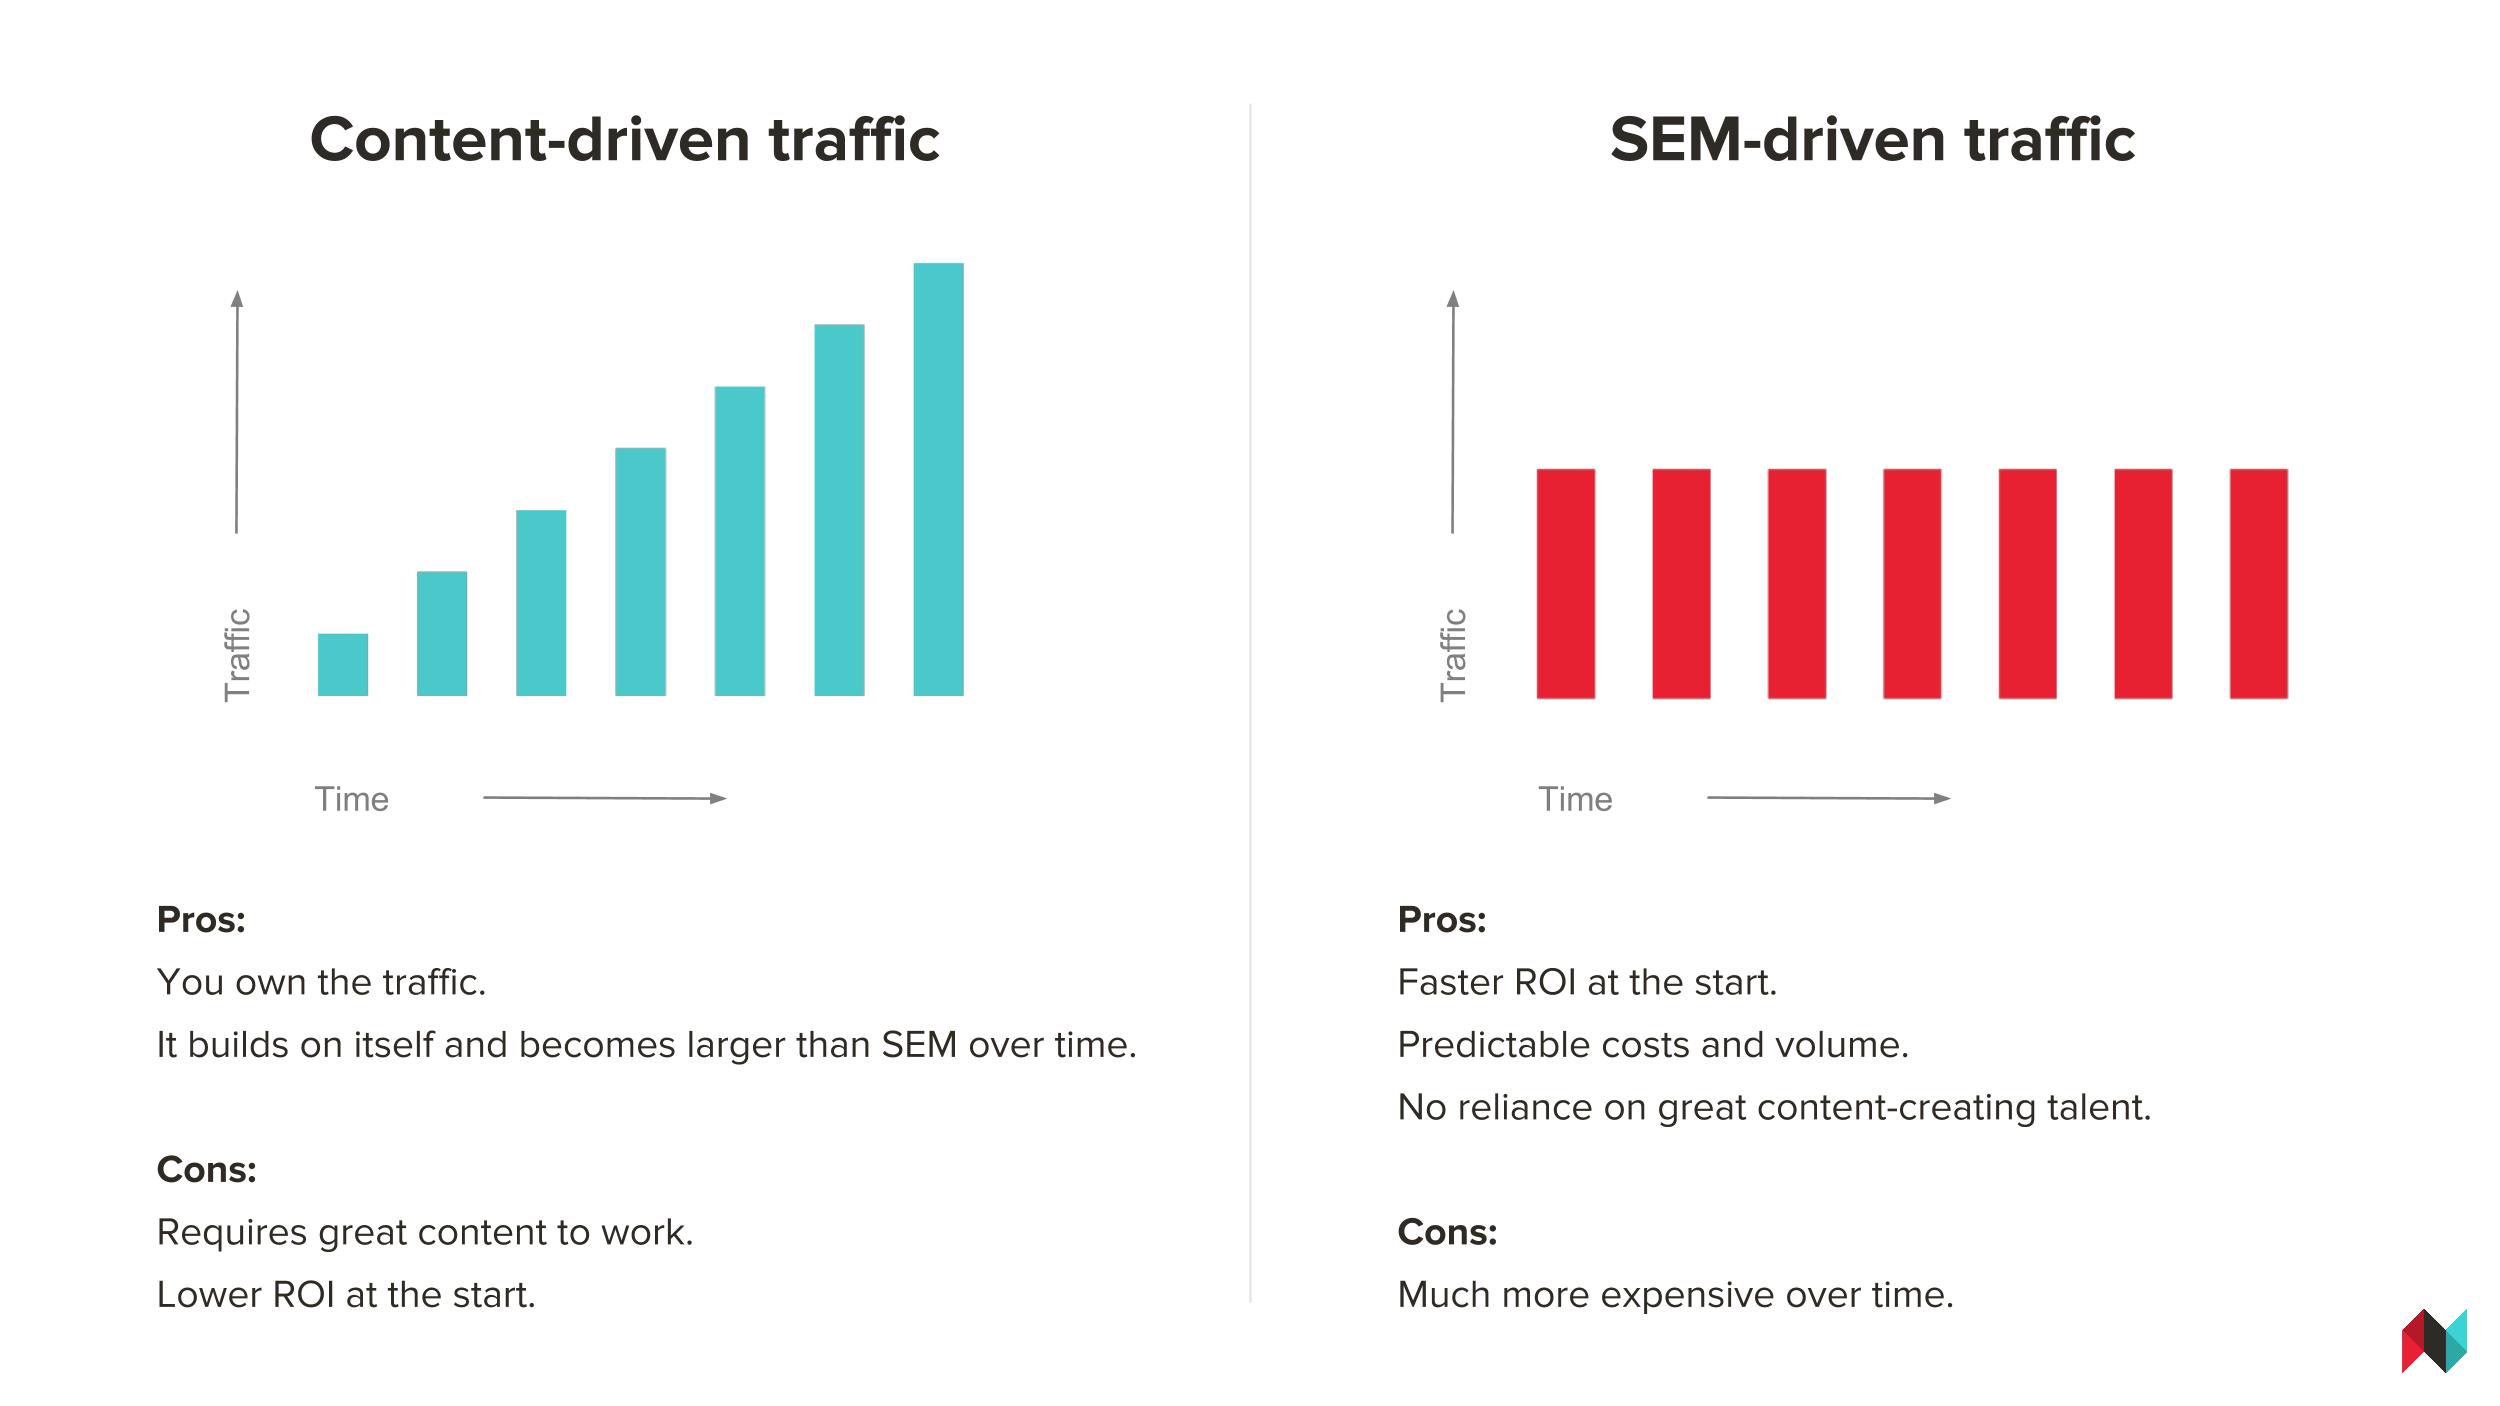
On the upside, paid search delivers results – fast. Once you launch a search engine marketing (SEM) campaign, you see the return almost instantly. You can easily predict your ROI based on your spend. And you’ll always see results – no matter how amazing or mediocre your content.
Hence, you don’t need to rely on an expensive agency to manage articles, videos, or infographics on a regular basis. There are multitudes of content marketing platforms out there that can do this for you.
On the downside: SEM traffic is only as sustainable as the dollars you put against it – your traffic will drop the minute you reduce your spend.
As a result, SEM becomes very costly over time, as marketers keep feeding the machine.
Content marketing, on the other hand, is a long game. It has a compounding effect, but that means it will take months before you see the true content marketing ROI reflected in your SEO strength.
Unlike SEM, content marketing requires a substantial upfront investment. You need to spend time creating high-quality content (e.g. long form articles, explainer videos, blogging, promoting through social media channels like LinkedIn, etc.) that will capture your audience’s attention.
Once you release the content, you’ll see some results, but the true payoff will come months later.
Blog content that is tailored to your target audience will yield organic traffic that will rival the clicks you need to pay for through AdWords at a fraction of the cost.
If the types of content you produce are what your target audience is looking for, the effect will compound over time.
You can also measure the ROI of your content through backlinks. Reputable sites linking back to your content is as important of a ranking factor as ever.
And the best part is, you own all of it.
How to Measure Paid Vs. Organic Search Traffic:
If you rank highly for a topic, find out what would be the equivalent AdWords spend to drive the same amount of SEM traffic for that topic.
Compare the spend with the search traffic your site receives from paid search advertisements, versus traffic due to a high organic search ranking.
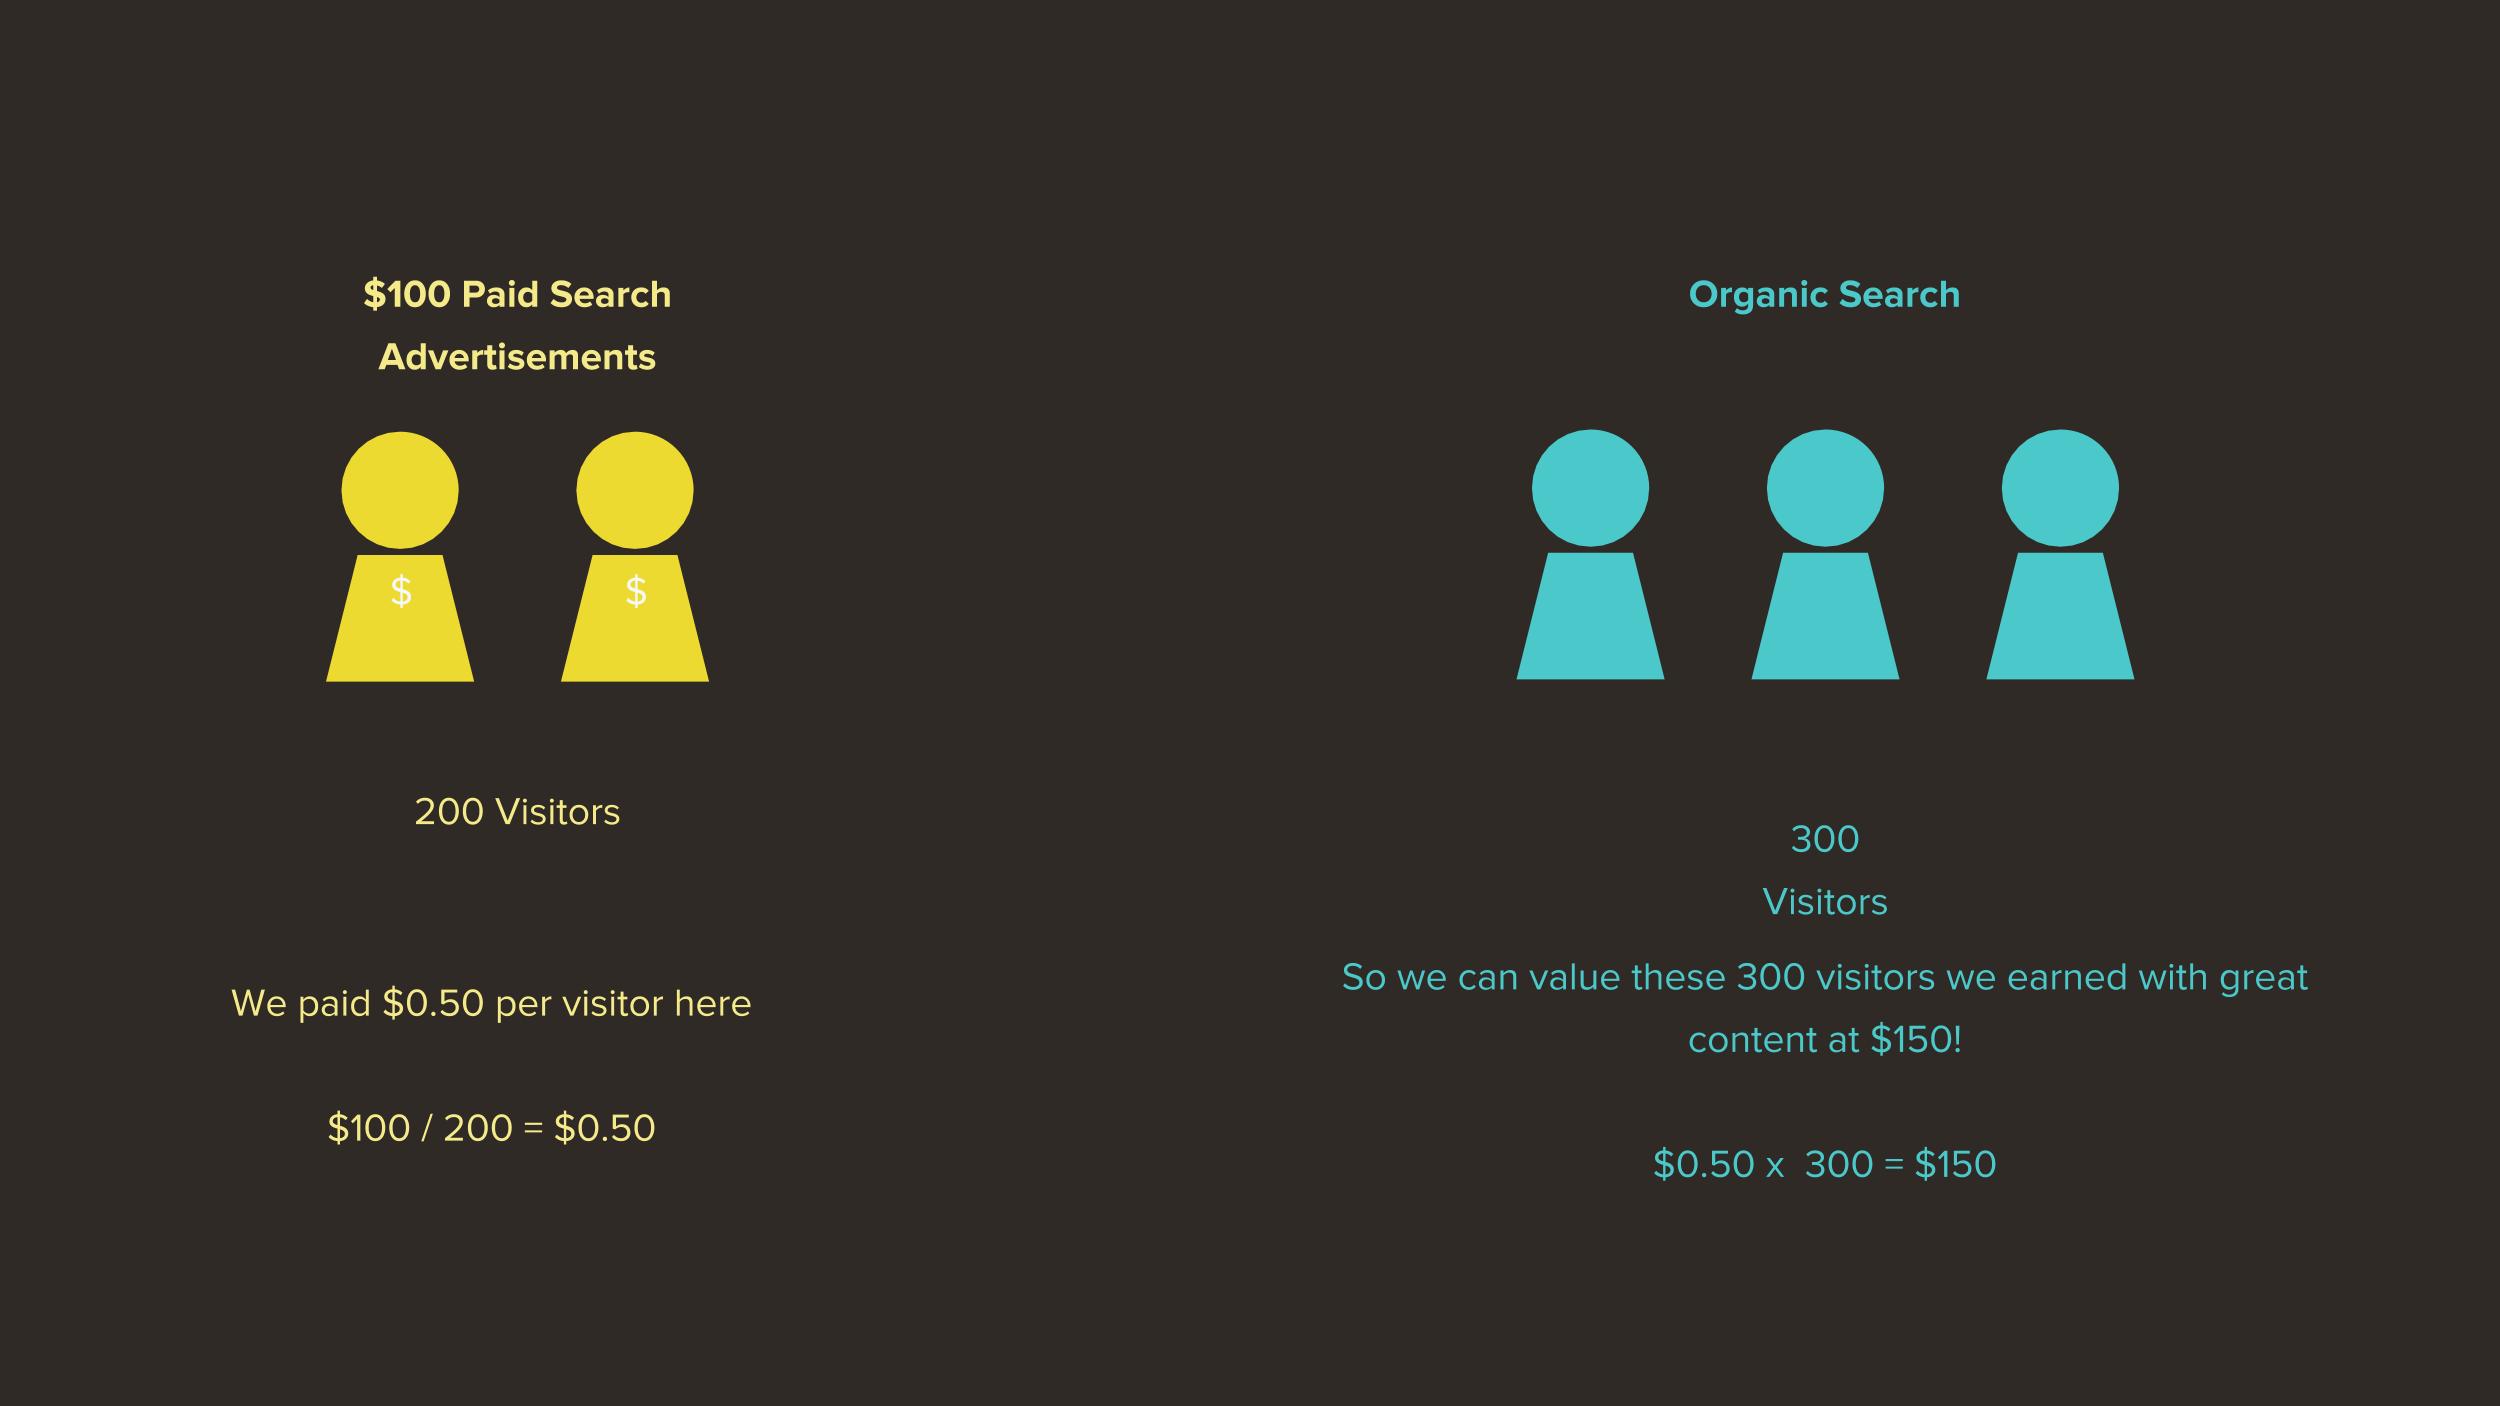
Here’s an example to illustrate the point:
Suppose an airline – let’s call it “Cloud City Air” – spent $100 in paid search advertisements around the term “Cloud City Air beach destinations,” and received 200 visitors as a result of that spend. Each visitor, then, cost the airline $.50.
But in comparison, say the airline also received 300 visitors via organic searches for “Cloud City Air beach destinations” – because they had a highly ranked, SEO landing page filled with great articles, beautiful images, and travel deals for sunny getaways.
Those visitors cost the airline $0 in search advertisements. But the airline could value those visitors at $150, based on its paid search spend.
2. Unbranded Paid vs. Unbranded Organic Search Traffic
In the exact same manner, compare your unbranded paid traffic to your unbranded organic search traffic.
Any visitor that searches your brand name already knows where they want to go. (For example, people searching for “Welcome software” or “Welcome Insights” are looking to engage with us.)
Unbranded organic search traffic is important to calculate so you can learn about the people who didn’t know where they would end up.
They had a question, asked a search engine for direction, and that interaction brought them to you. (For example, some people come to Welcome after Googling “content marketing companies” or “content marketing software.”)
By seeing how well you rank on those unbranded organic search terms, you’ll have a better sense of how much you’re saving in SEM dollars.
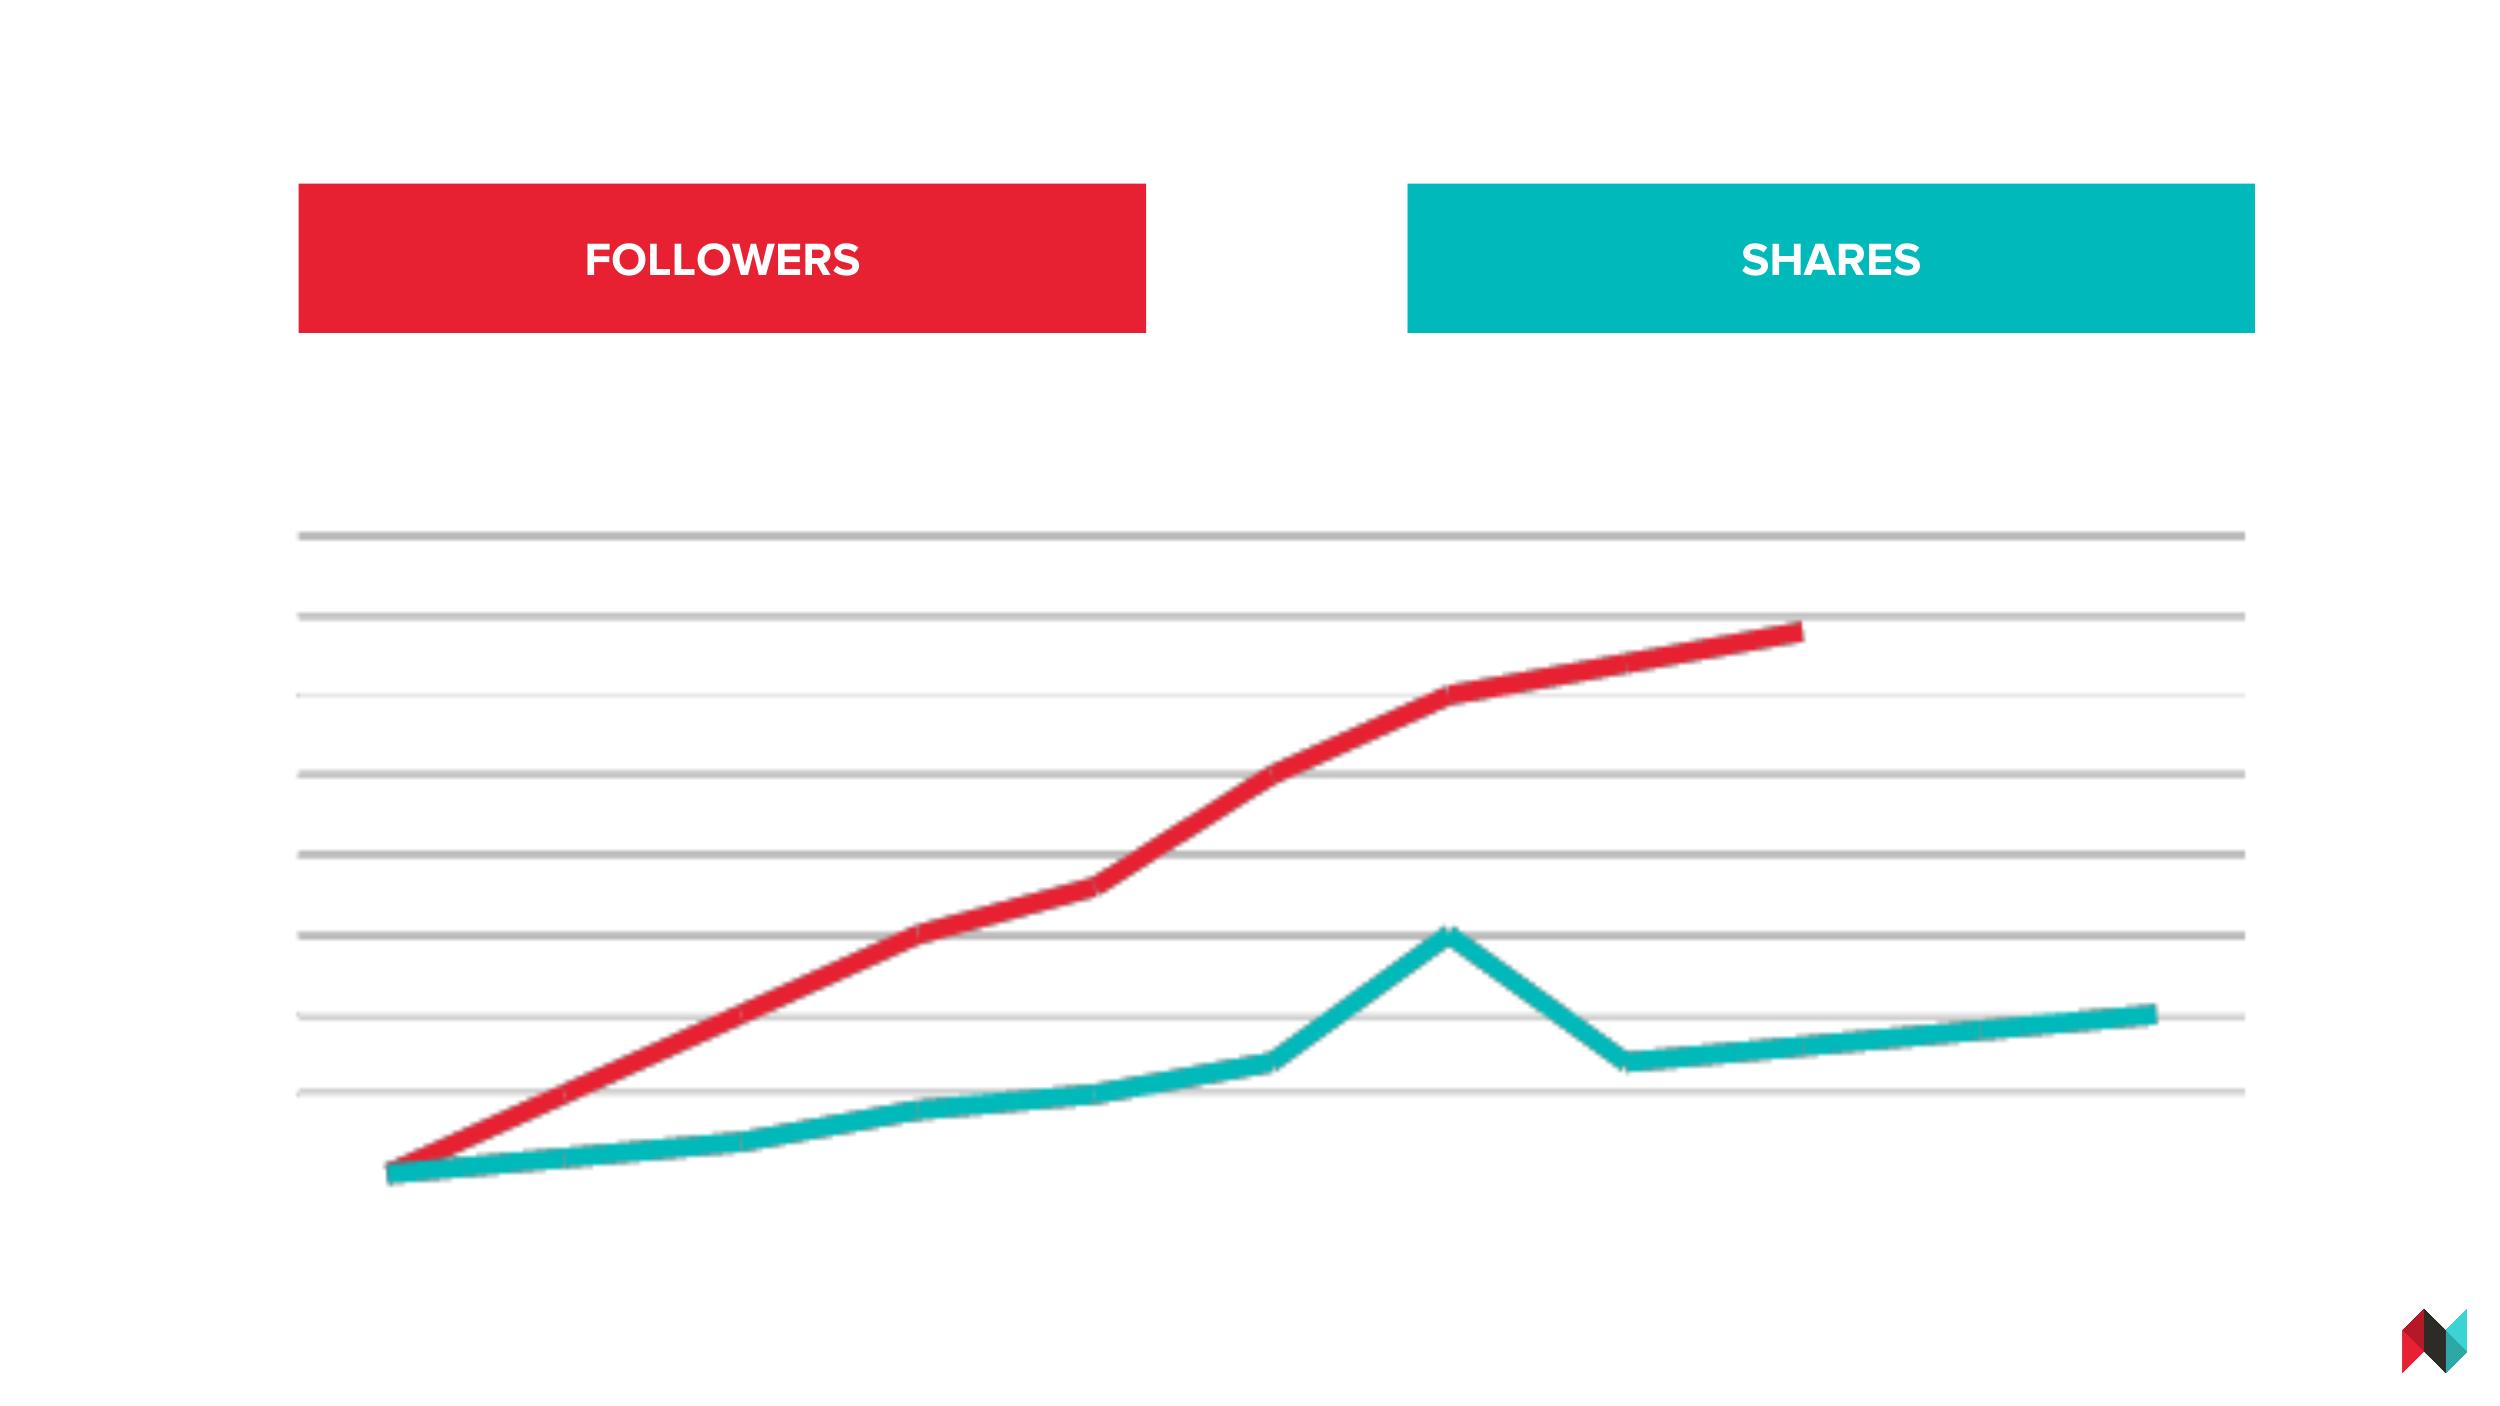
3. Social Media Shares + Followers
Brands should also track their social follower growth against their total number of shares.
B2B marketers often get enamored by the latter, but the more valuable metric is an increase in social media audience.
These are people who are opting in to future content from your brand. If both are increasing, this indicates that your organic social shares are reaching the right audience – and building it among those new people.
4. Share of Voice
Share of voice essentially measures how much your brand or product is talked about compared to your competitors for a specific topic.
If you’re not working with a tool or agency that calculates share of voice, you can set up Google Alerts to track your mentions against your competitors, and tally your PR hits in key publications.
In addition, you can also use social trackers to measure the volume of conversation around your brand versus your competitors.
Business Goal: Brand Health
If brand health is your objective, you’re measuring how your audience feels about you.
KPI benchmarks to Measure:
- Repeat Visitors
- Subscribers
- Social Likes + Followers
- Offsite SEO
- Pageviews
- Click-through rate (CTR)
- Articles Viewed
- Engagement Rate
- Average Engaged Time
- Bounce Rate
You’re probably very familiar with these metrics, so we won’t go into detail with the first seven.
When measuring them, it’s important to do so through the lens of relationship-building – as in, nurturing people who will become loyal to your brand and always have it top-of-mind.
Remember, 96% of people visiting your site aren’t actually ready to purchase from you, according to Social Media Today, 2014.
So, you need to think of creative ways to continuously bring prospects back to your site so that when they are ready to purchase, they choose you.
We will take a deeper look at average engaged time, though. Your ratio of time on site compared to pageviews could mean different things:
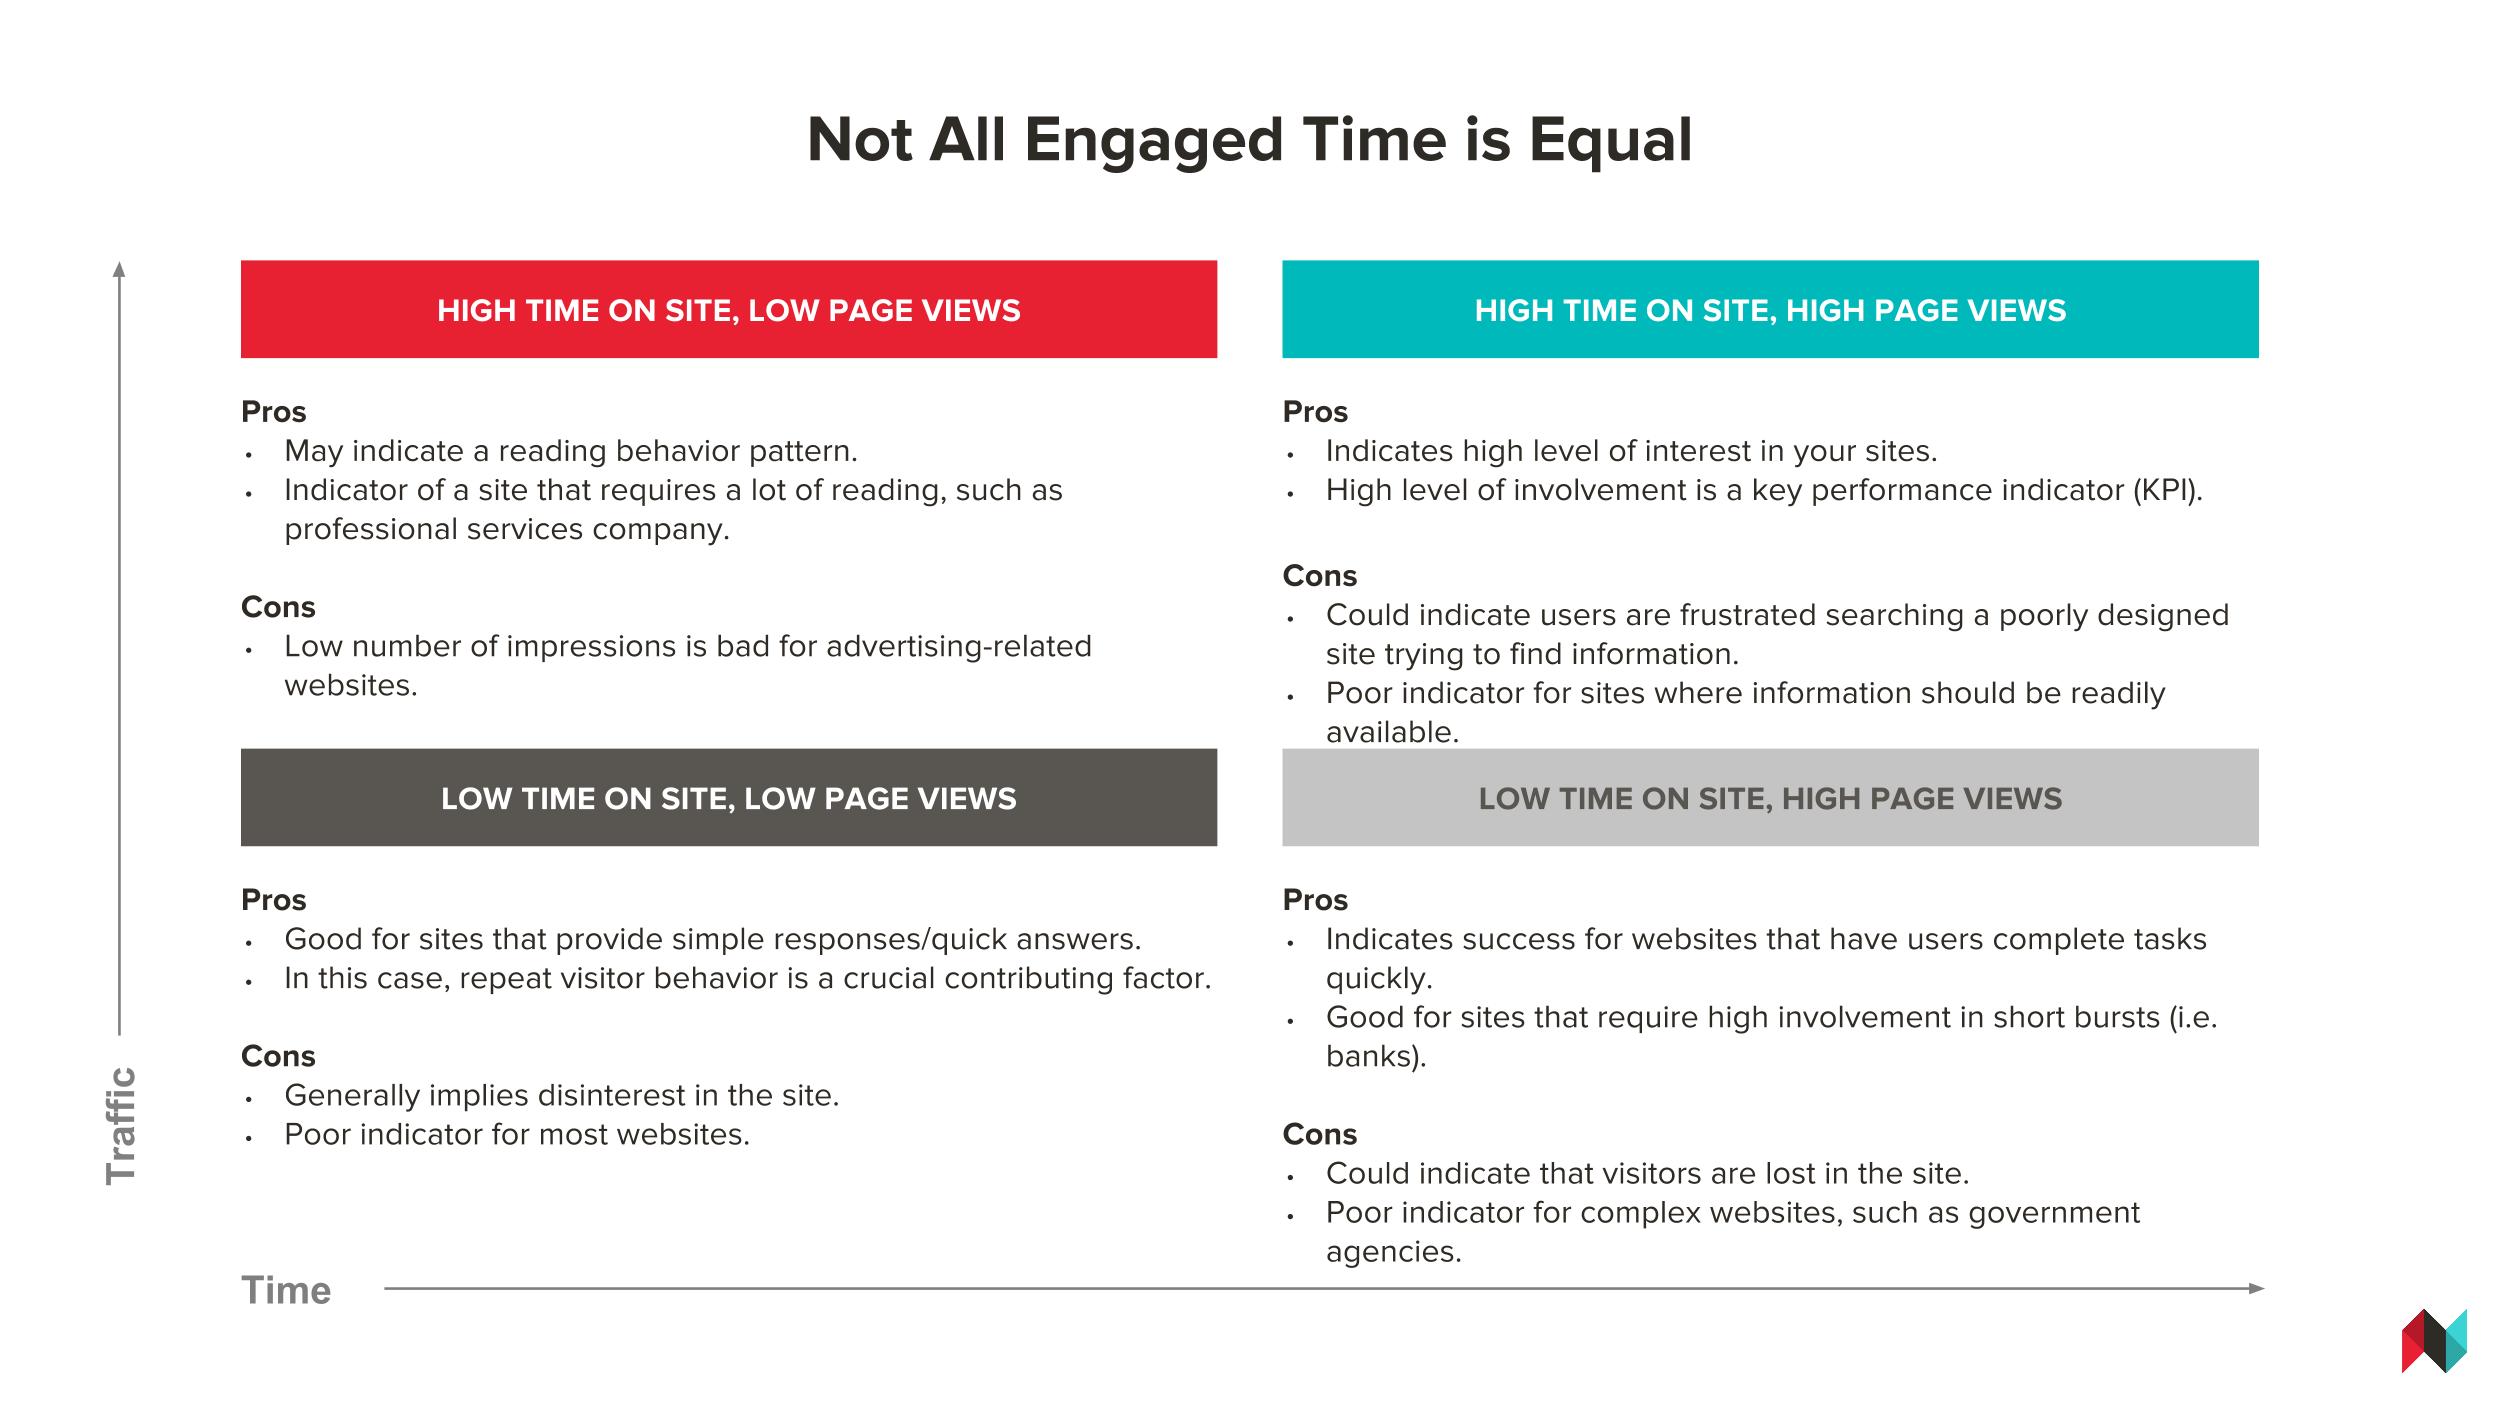
When deciding your goal for average engaged time, consider which one will best measure against your larger business goal.
Business Goal: Conversions
KPIs to Measure:
- Cost per lead, opportunity, deal
- Total conversions/e-commerce checkouts
- Percentage of leads sourced by content marketing
Let’s take a look at how we do content marketing.
At Welcome, when we think about conversions – a major KPI that helps us prove our revenue impact – we look at conversions across our entire sales funnel.
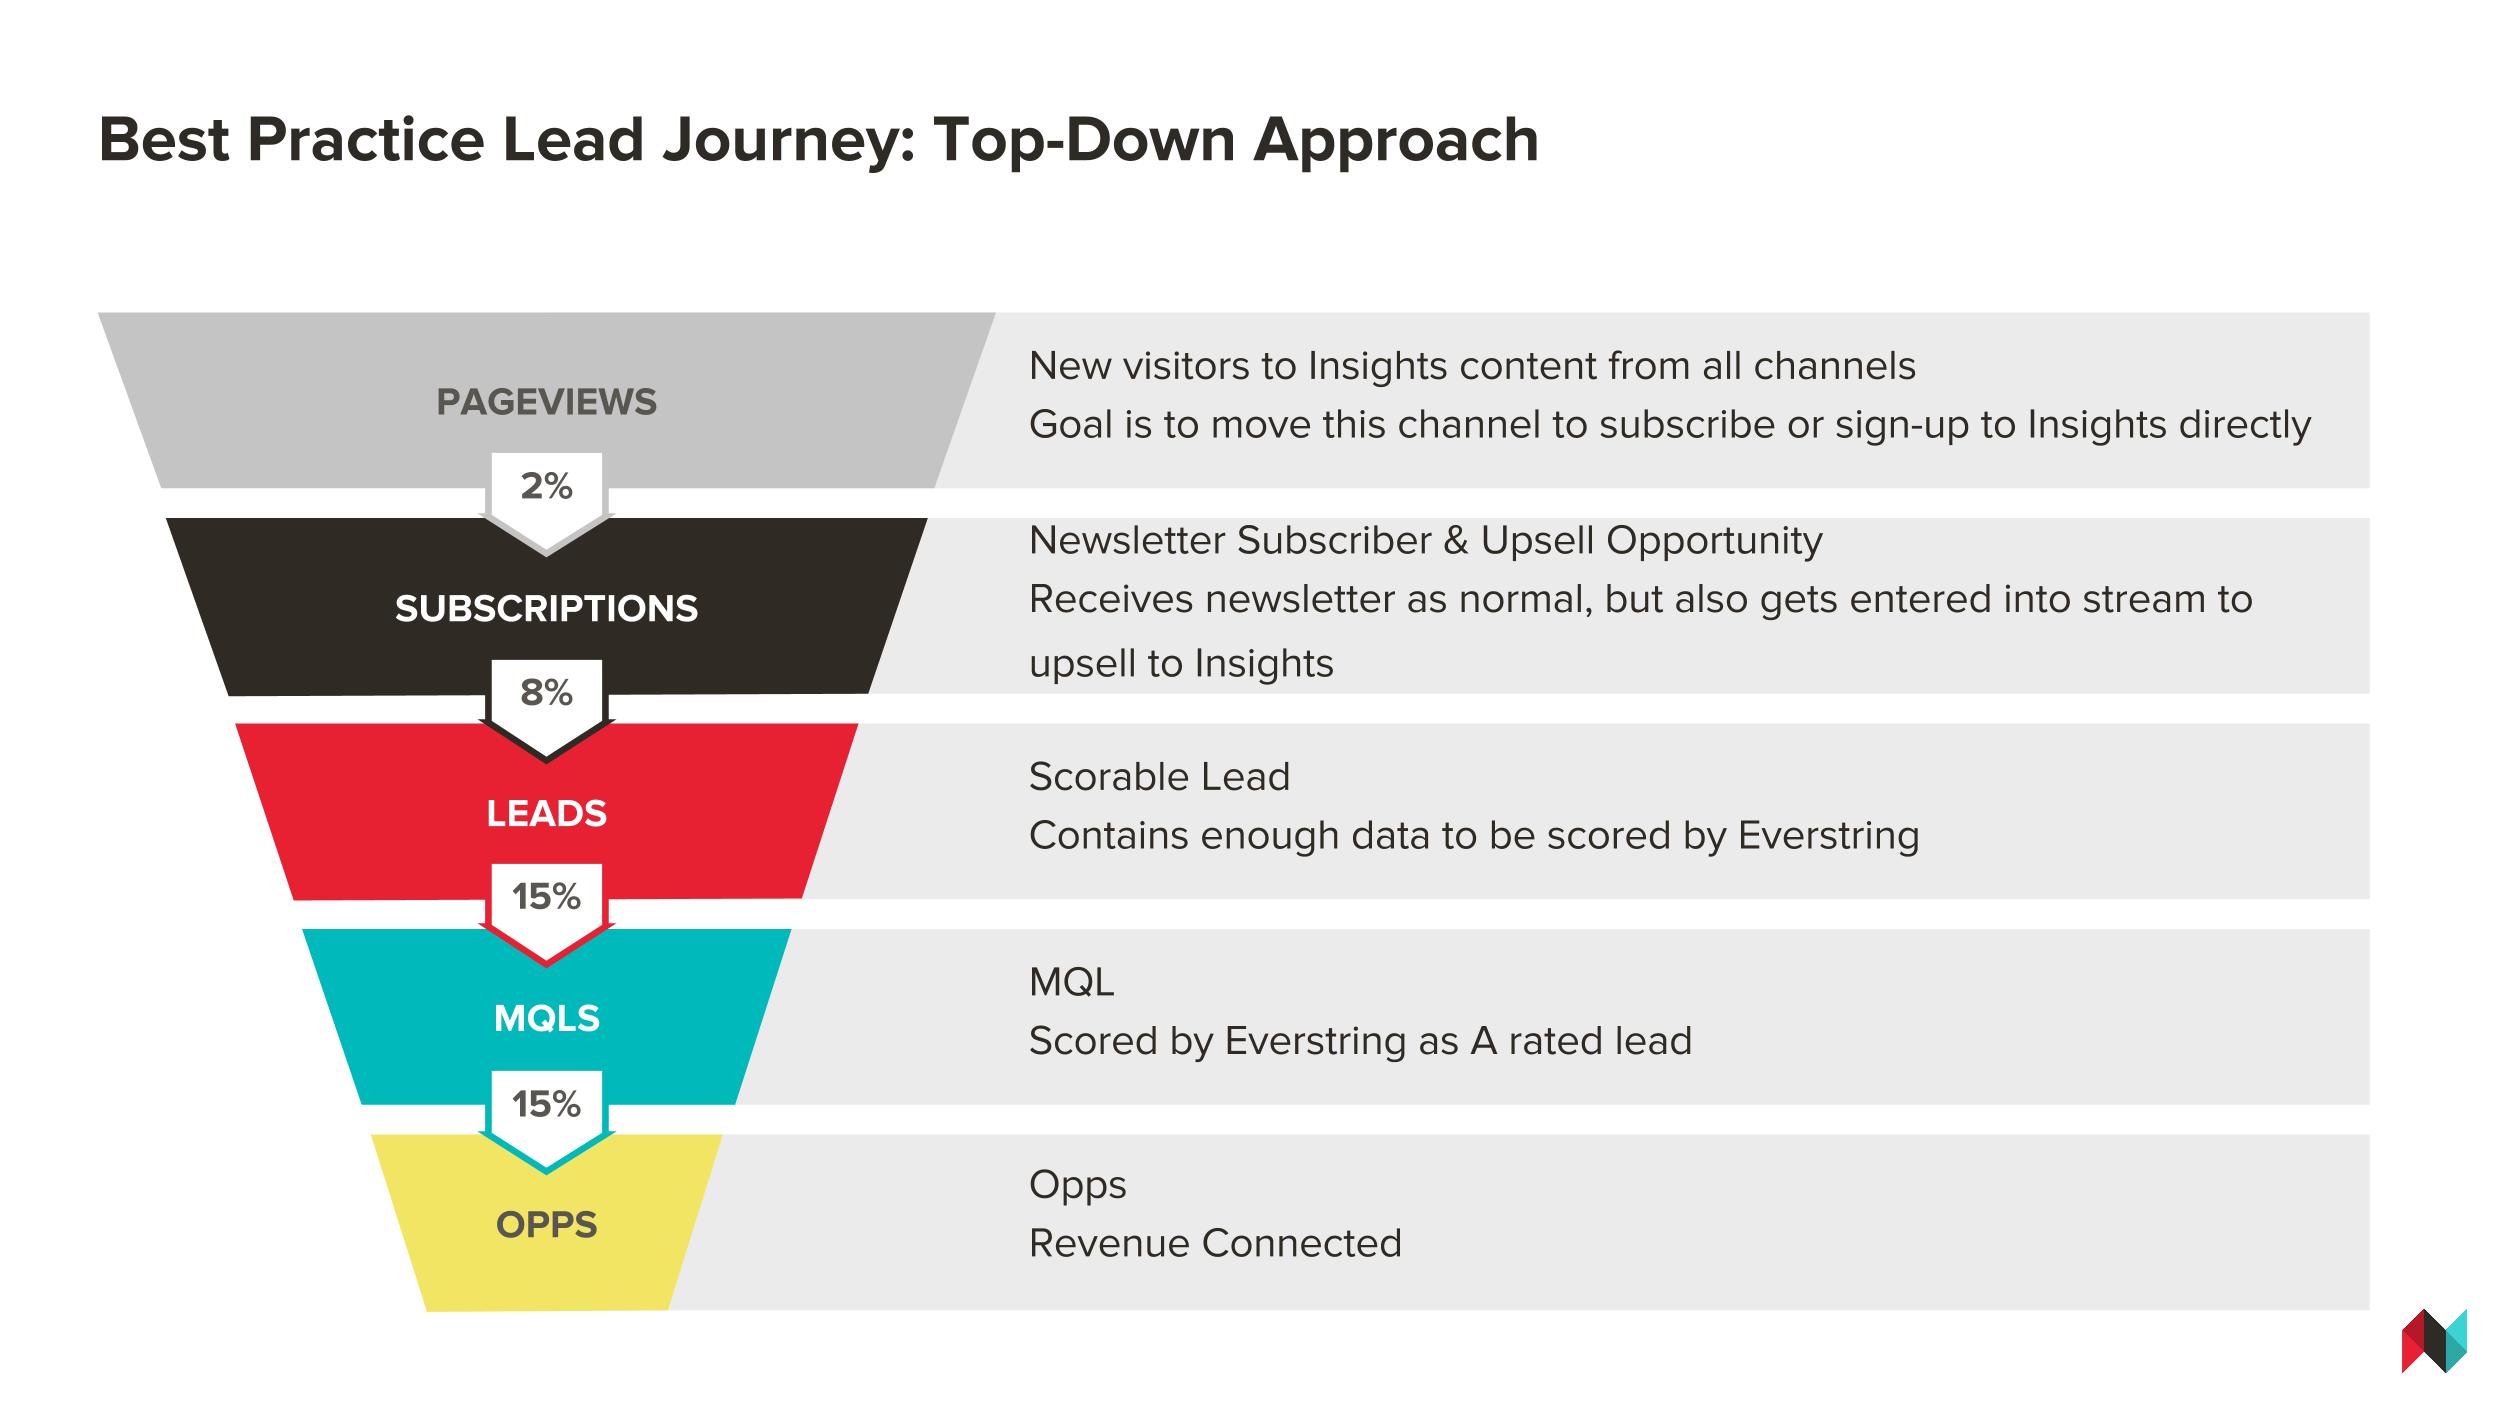
We start by looking at intent: Are people taking actions that indicate they want to start building a relationship with us?
For example, are they going from our Insights blog to our main domain or vice versa?
Or are they repeatedly downloading or engaging with our content over time?
We then look at how they’re opting in to engage with us on a deeper level.
We don’t count newsletter subscriptions as leads, for example. Instead, we require that subscribers have to fill out one additional form with more information on who they are (including job title and company).
This enables us to score our leads and work to keep them engaged over time with more content: newsletters, webinars, events.
Throughout this process, we’re also measuring relevancy. We work with our sales teams to align on our definition of a Marketing Qualified Lead (MQL) to ensure that those people matter to our sales team.
And we evaluate how our content marketing channel compares to our other channels, and how it works with or performs in comparison to events, AdWords, sales outbound, and referrals.
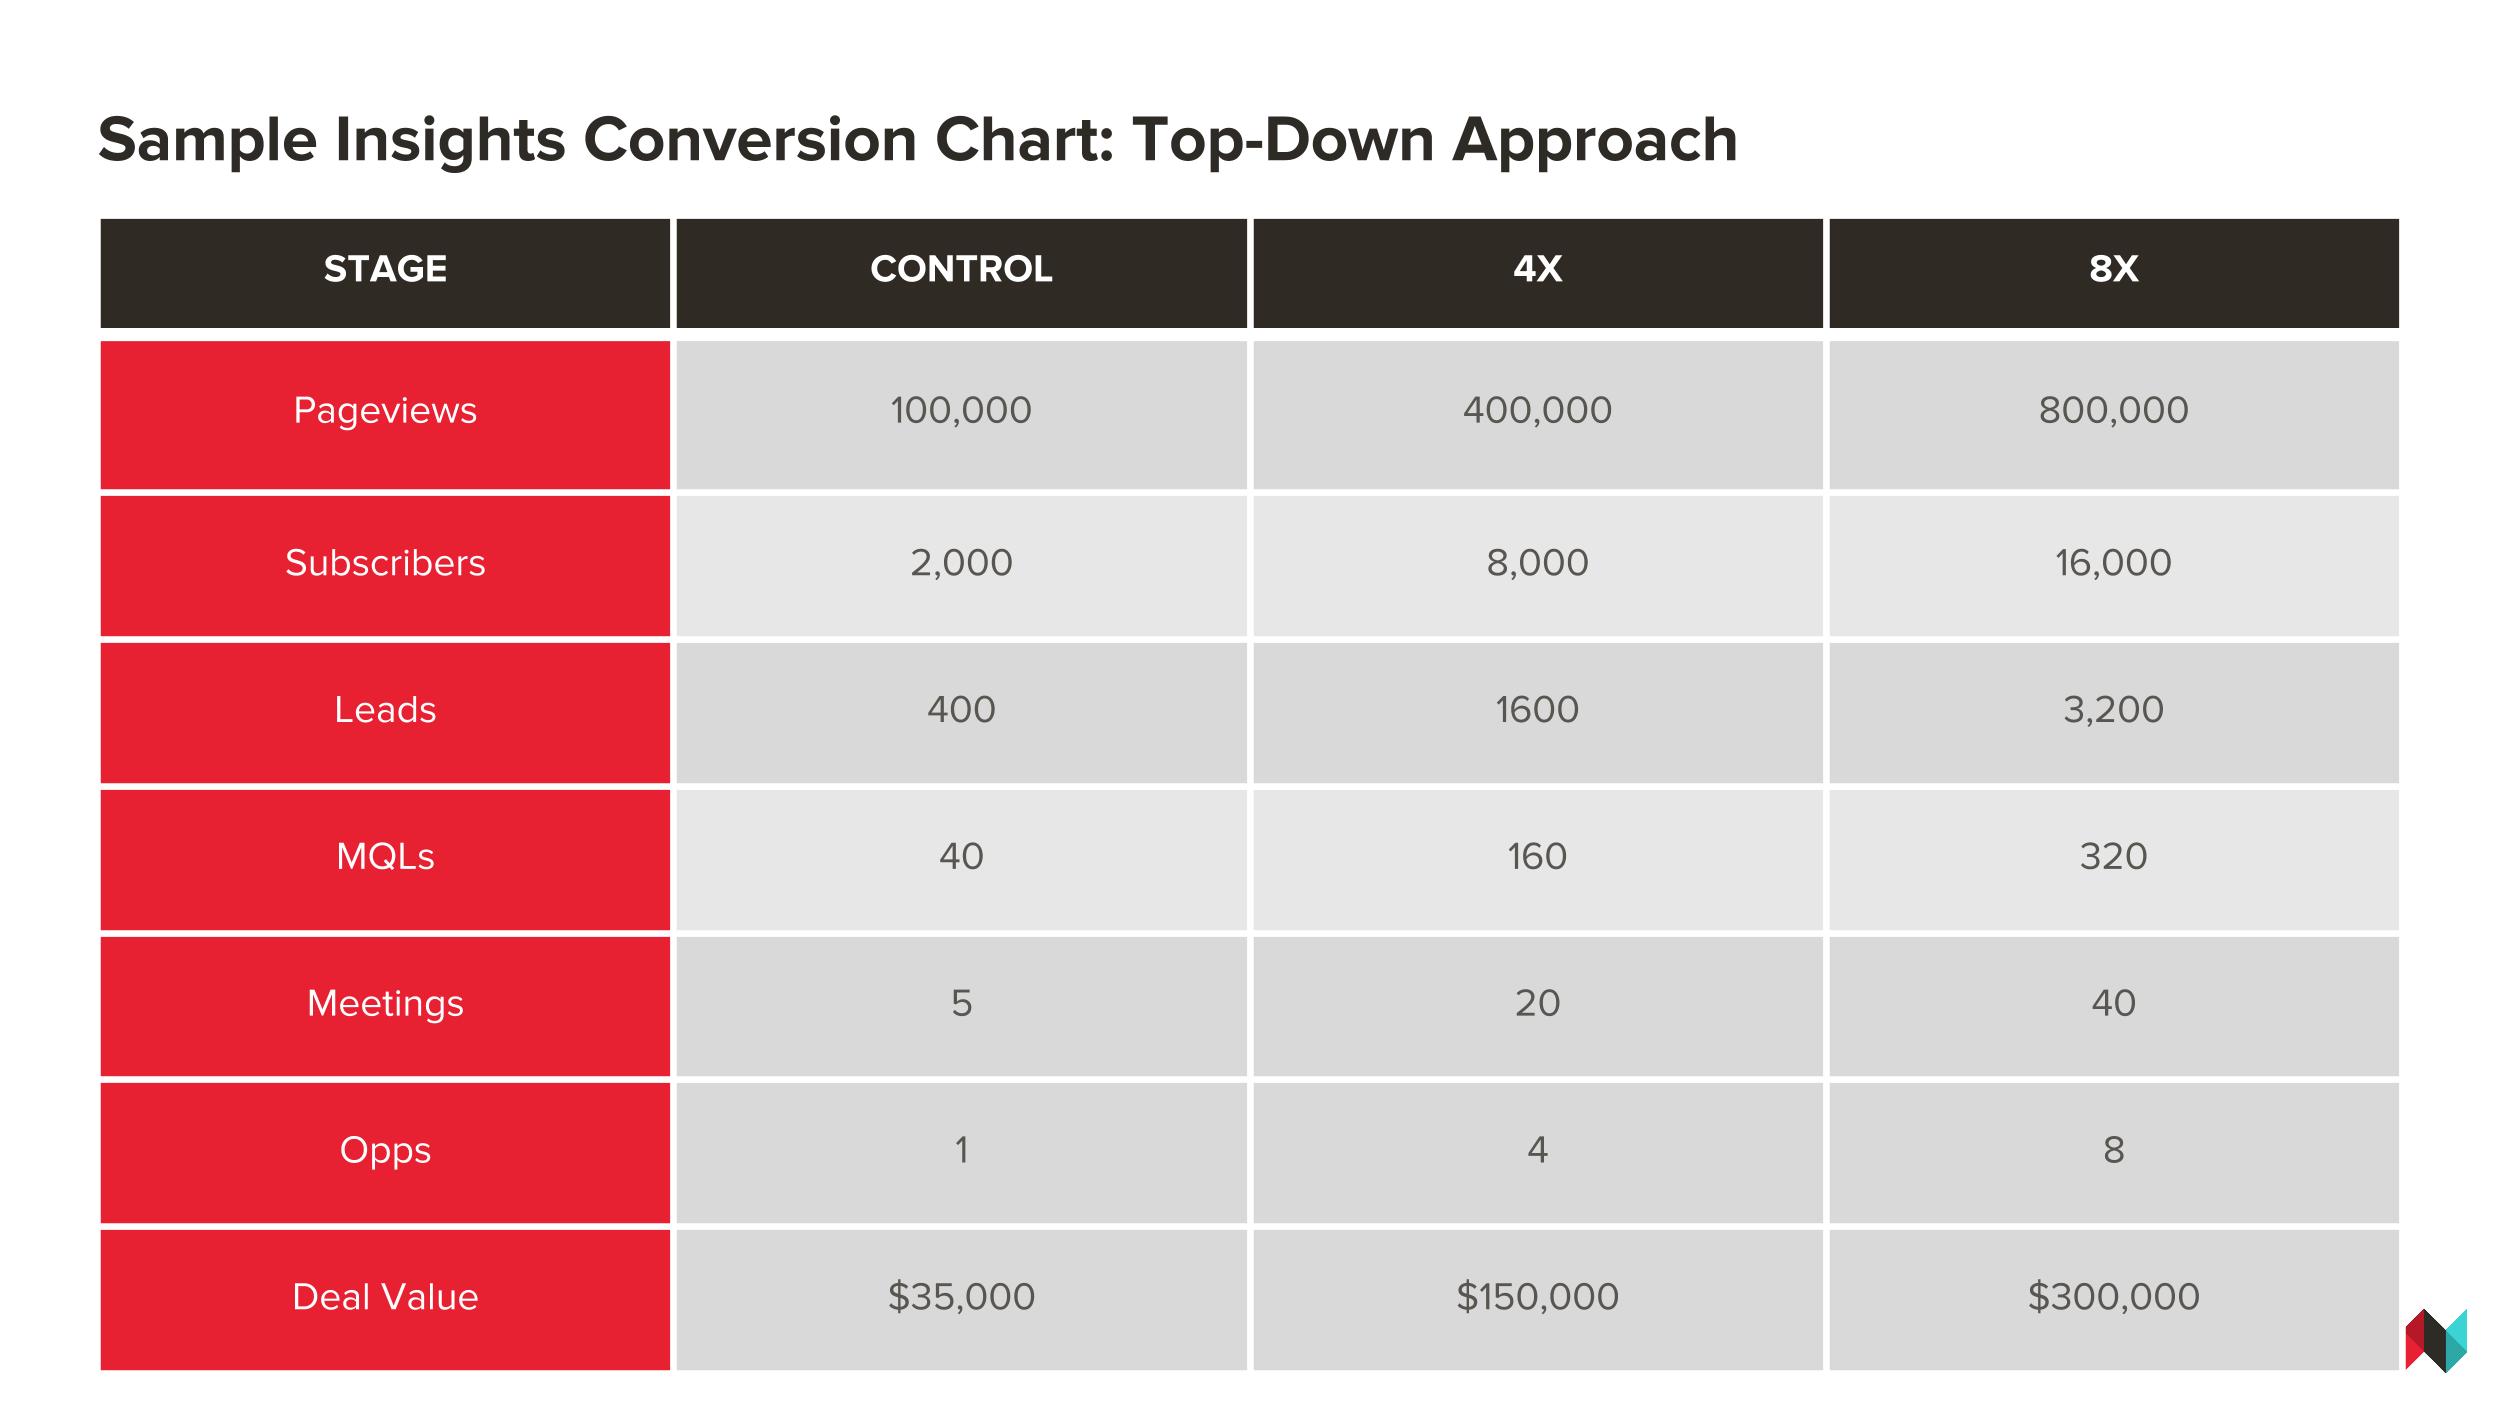
We look at the number of deals closed and compare cost per opportunity and deal against our other channels. The trick is to measure how content marketing is growing and improving over time.
With enough data over time, you can create a predictive model and start to estimate how much you can expect in deals when compared to your pageviews.
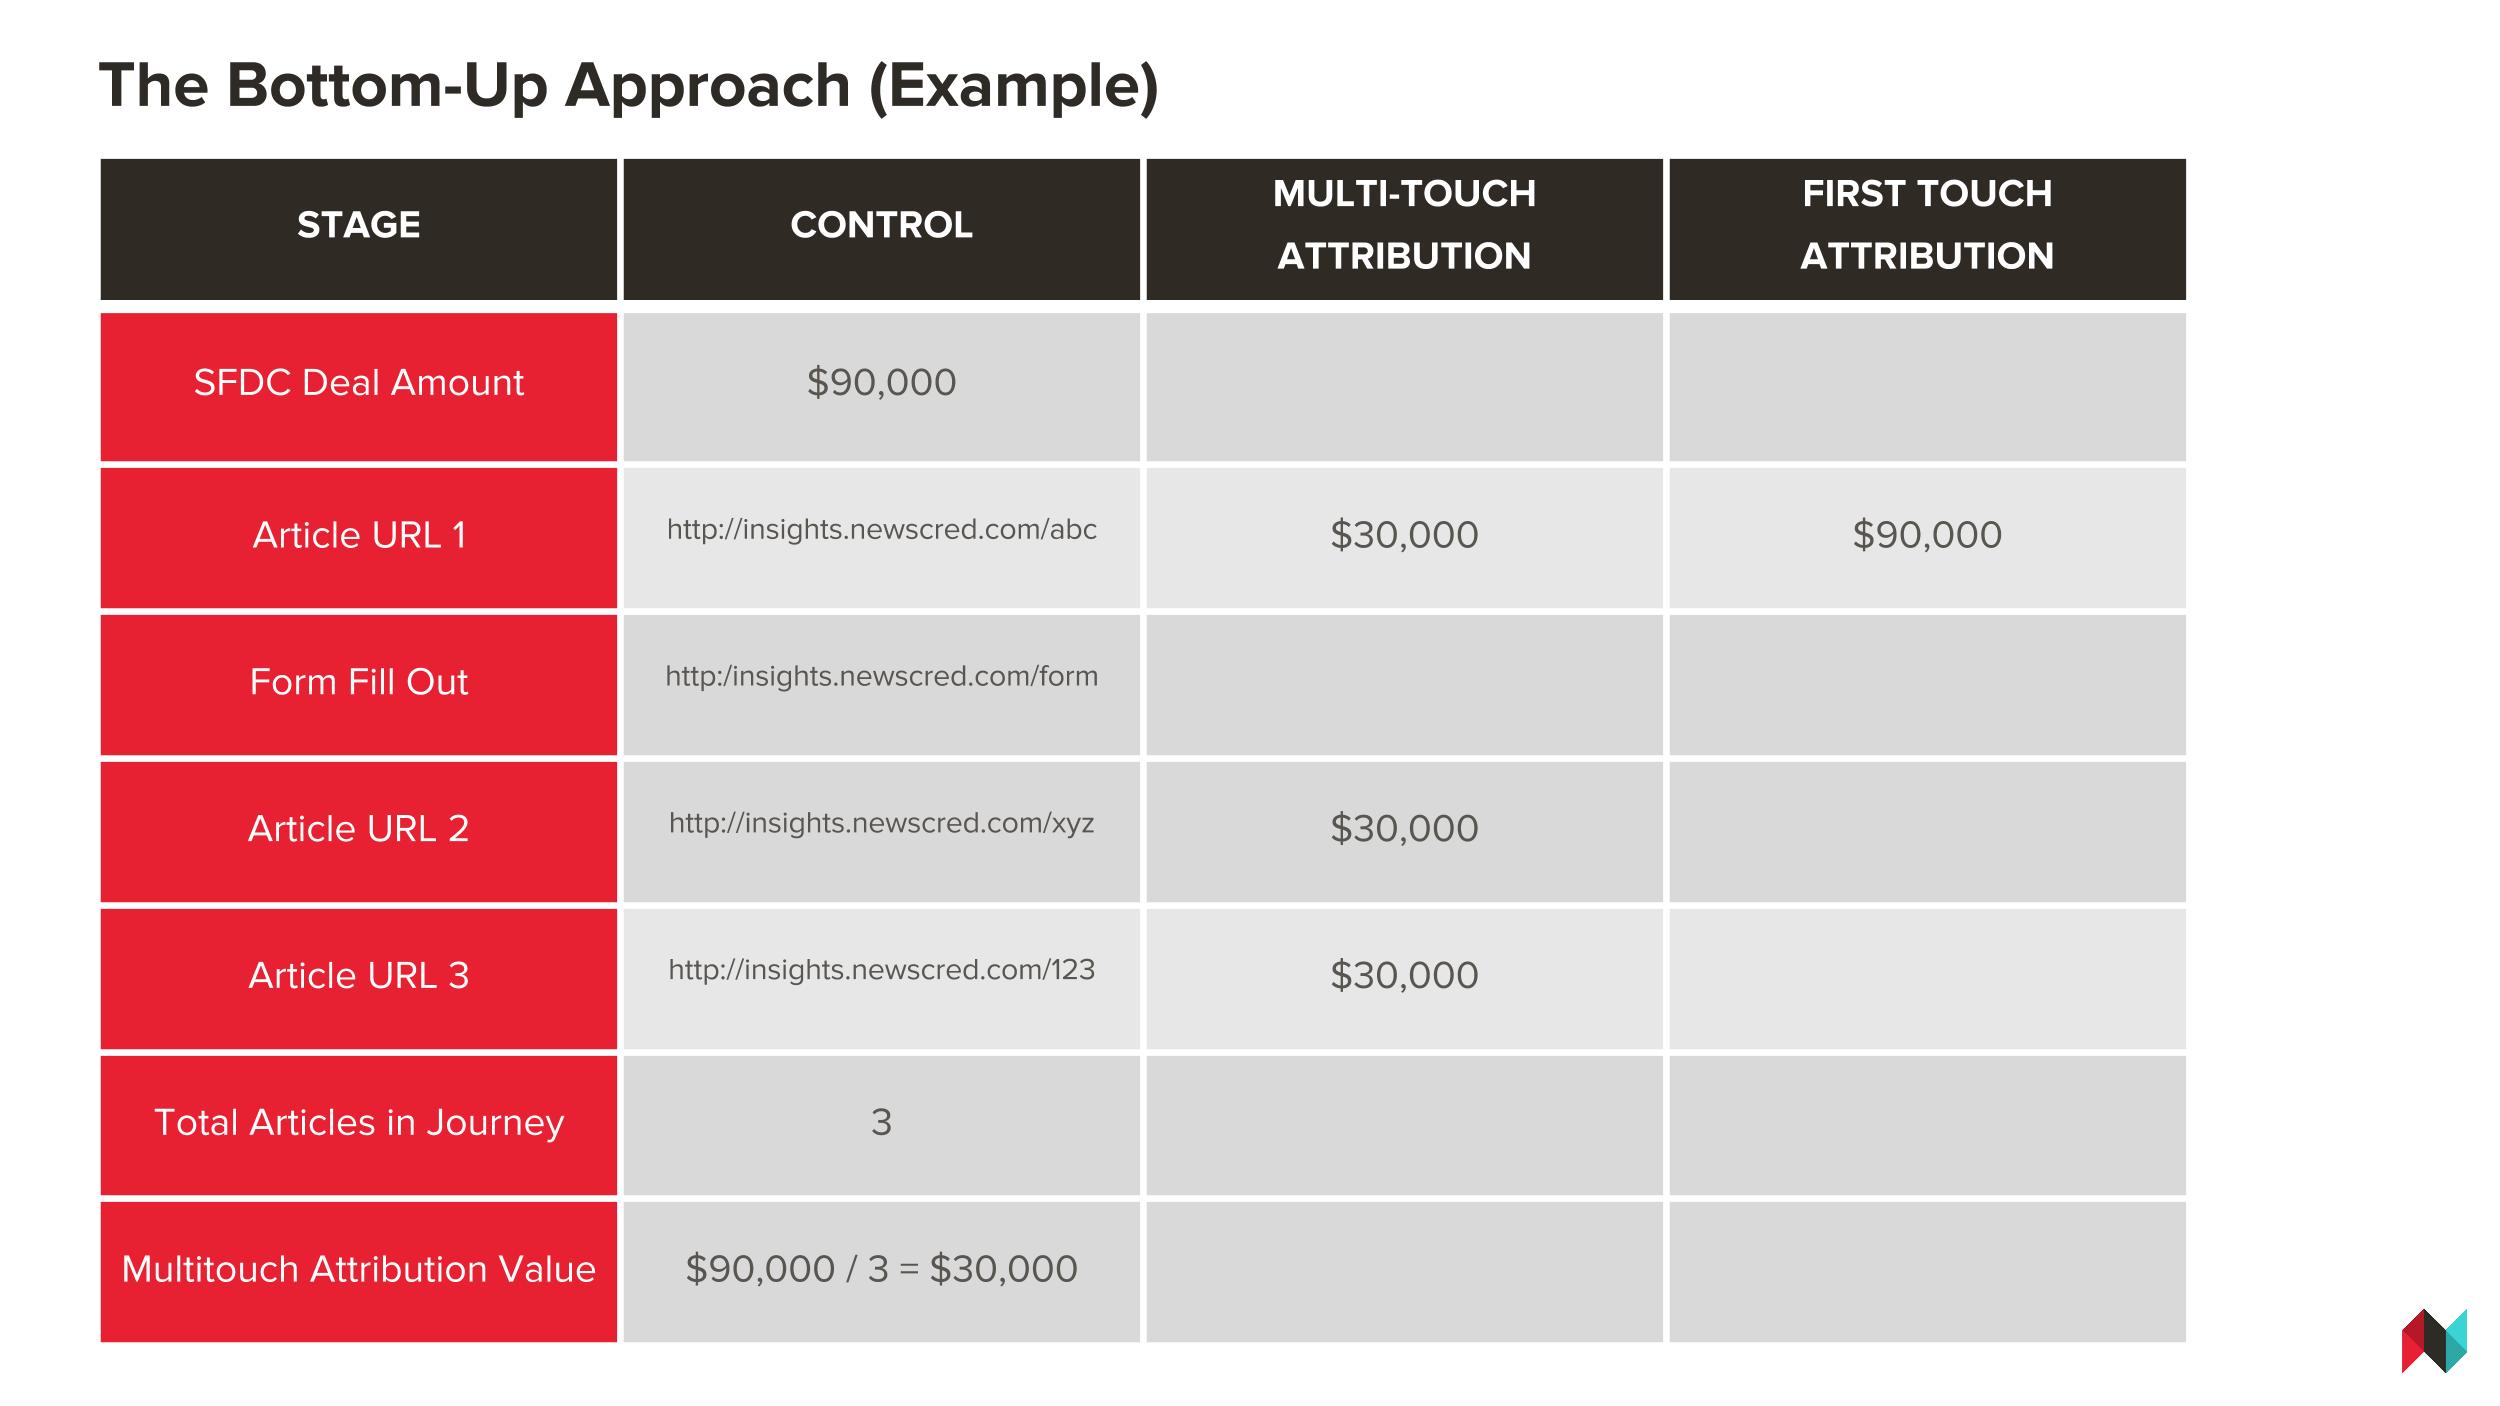
You can also take a bottom-up approach to measuring conversions.
Though this method is manual and time-consuming, it can give you great insight into individual customer journeys.
You’ll be able to see the pieces of content that influenced the buyer to take further action before ultimately converting.
Once you’ve analyzed numerous lead journeys over time, you’ll be able to see what content was most influential in nurturing and converting leads.
You can use that data to inform your content strategy. The approach below works if you have Marketo and Salesforce in your marketing stack, but a similar principle would work with other marketing automation tools as well.
Here’s a step-by-step look at the bottom-up process we use at Welcome:
- Inspect every deal that closes in Salesforce and for each, note the closed won amount.
- Find the corresponding lead in your CRM.
- Look at the lead’s Activity Log.
- Filter on “Webpage Visits” (or “Interesting Moments”).
- Record each piece of content that was touched.
- Note if the first touch in the activity history was a piece of content.
- Take the total deal amount from Salesforce, and divide by number of pieces touched.
- Attribute the amount from step 7 to each piece of content equally. This is your multi-touch attribution value.
- If first touch was a piece of content, assign the Salesforce amount in full to that piece of content. This is your first touch attribution value.
(Don’t feel like doing this all manually? Welcome’s content marketing software allows you to track content journeys and the impact of content on leads, opportunities, and deals. Out-of-the-box, it can even tell you the dollar attribution for each piece of content.)
Business Goal: Loyalty and Retention
Companies can enjoy incredible economic benefits when they retain customers.
“Fully engaged” customers (those with a strong attachment to the brand, or brand ambassadors) deliver a 23% premium over the average customer in share of wallet, profitability, and revenue.
And boosting customer retention by 5% can increase profits by as much as 80%.
Retaining customers can also increase your bottom line for the following reasons:
- Lower acquisition costs: Existing customers require less promotion, and therefore a smaller sales force.
- Repeat customer revenue growth: Customers spend more over time.
- Lower operating costs: Long-term customers make fewer demands on admin and servicing.
- Customer referrals: Loyal customers bring in the right new customers and low/no cost.
- Premium pricing: Satisfied customers are less price-sensitive.
Unfortunately, companies aren’t great at retaining customers. Most lose 50% of customers every five years. That disloyalty stunts company growth by 25% to 50%.
Content can play an integral role in retaining customers. Customer loyalty increases with the frequency of your interactions with them.
As you’re creating content to work across the customer journey, be sure to have assets and a distribution plan to retain existing customers.
Email marketing is a great retention tool for both B2B and B2C marketers when it comes to loyalty.
Forget clicks.
Even if a customer just sees you pop up in their inbox every now and again will be enough to maintain share of mind.
They’ll know where to find you when they’re ready.
KPIs to Measure:
First, figure out the percentage of your clients that read your content. (Use your marketing automation platform to do so.)
Look at that cohort and then measure the following against customers who don’t read your content:
- Renewal/Churn Rate
- Upsell Rate
- Average Order Value/ACV
At Welcome, we’ve found that the clients who engage with our blog are more loyal and have higher renewal rates: 33% of our clients subscribe to our blog, and of those, they:
- Have a renewal rate that is 41% higher than that of our overall client base (95% vs. 67%).
- Are 33% more likely to be upsold (23% vs 17%).
- Pay 24% more in monthly recurring revenue than the average client.
While it will take some time and effort to set up the systems to measure these KPIs, in the long run, you’ll have a much better picture of how well your content is performing against your business goals.
You’ll be able to put actual numbers against your objectives, measure performance over time, and optimize your program accordingly.
And with that data, you’ll be able to request larger content marketing budgets from your CMO and get more buy-in across your organization.